SafeSight leverages AI-powered computer vision to detect warehouse safety violations in real time and instantly notify managers—removing the need for manual CCTV review.
Introducing Proj 28 – DSV – SafeSight
SafeSight is an AI-powered warehouse safety system that uses synthetic image and video data to train YOLO-based
detection models. Running on Raspberry Pi and edge cameras, it detects forklift safety violations in real
time and sends video evidence alerts to supervisors. A centralised dashboard tracks violations by date, location,
and type, providing long-term analytics that improve safety compliance, prevent accidents, and give
management clear, actionable insights into reducing operational risks.
Team members
Yihe Wang (DAI), Tejaswini D/O Venketroyalu (ISTD), Kareena Sunil Nandwani (ESD), Lee Kyle Darren Liao (ESD), Ling John Wei (ESD), Toh Hengyi Lucas (ISTD), Ng Suat Ying (MArch)
Instructors:
Thomas Schroepfer
Writing Instructors:
Susan Wong
Dominic Edmund Kim San Quah
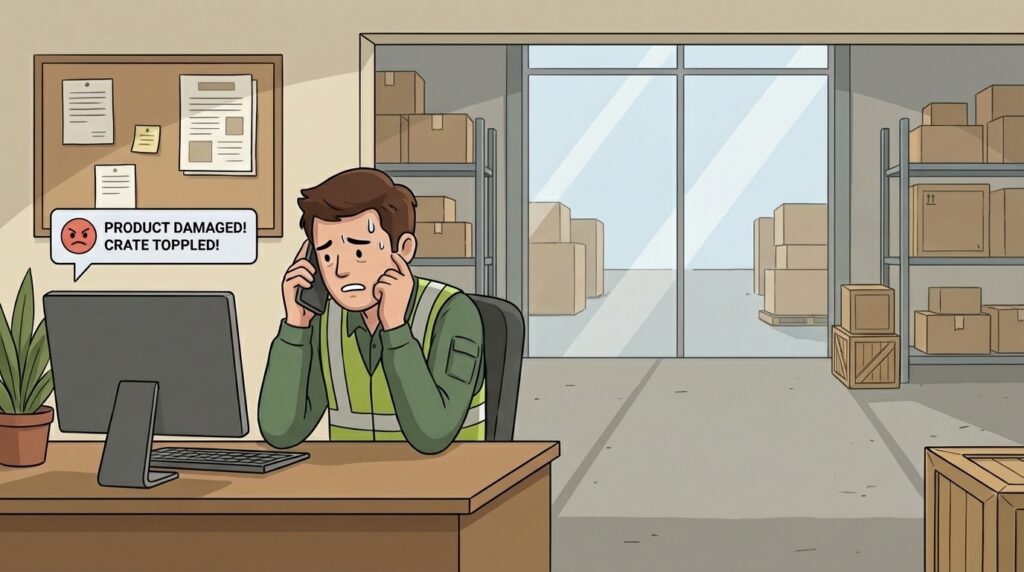
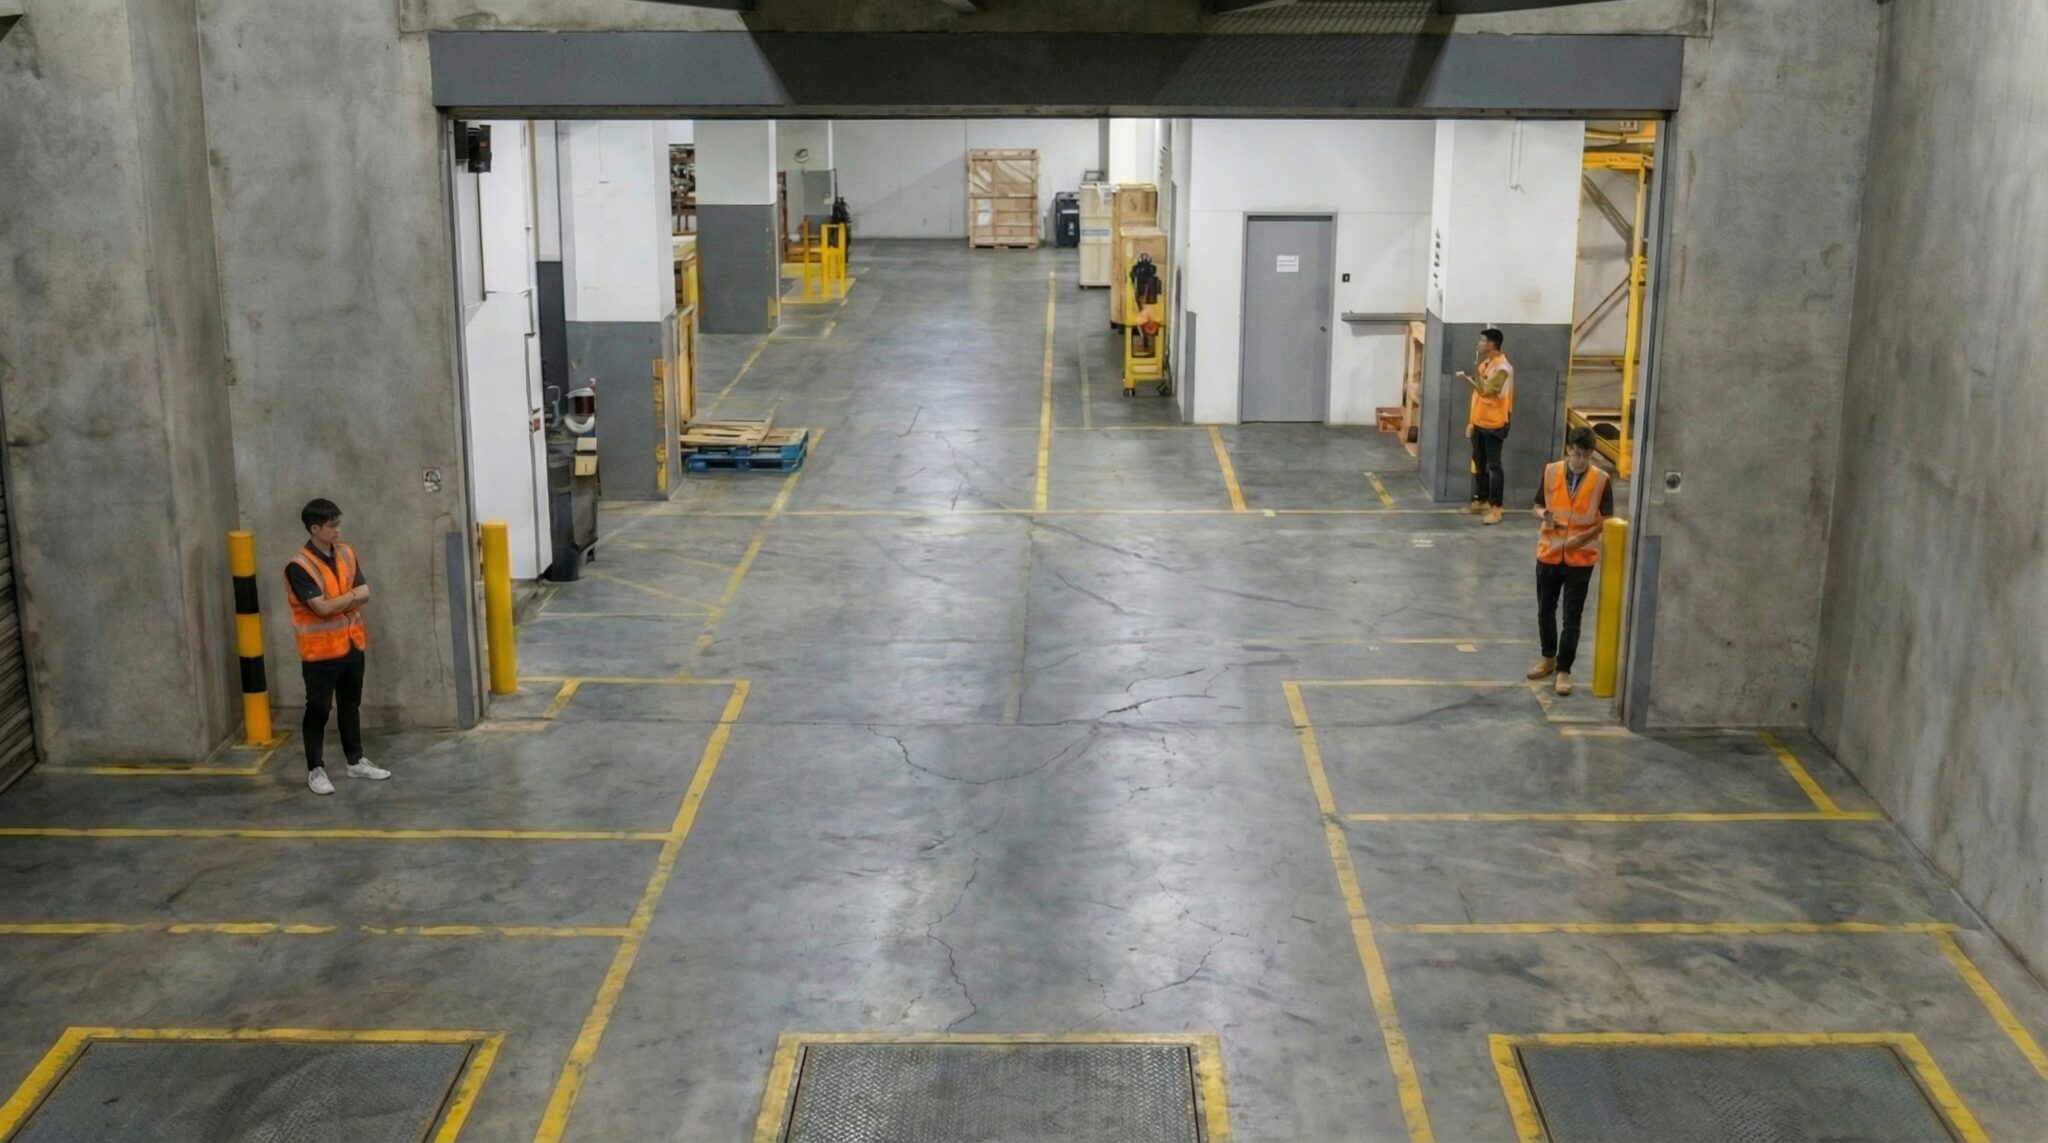
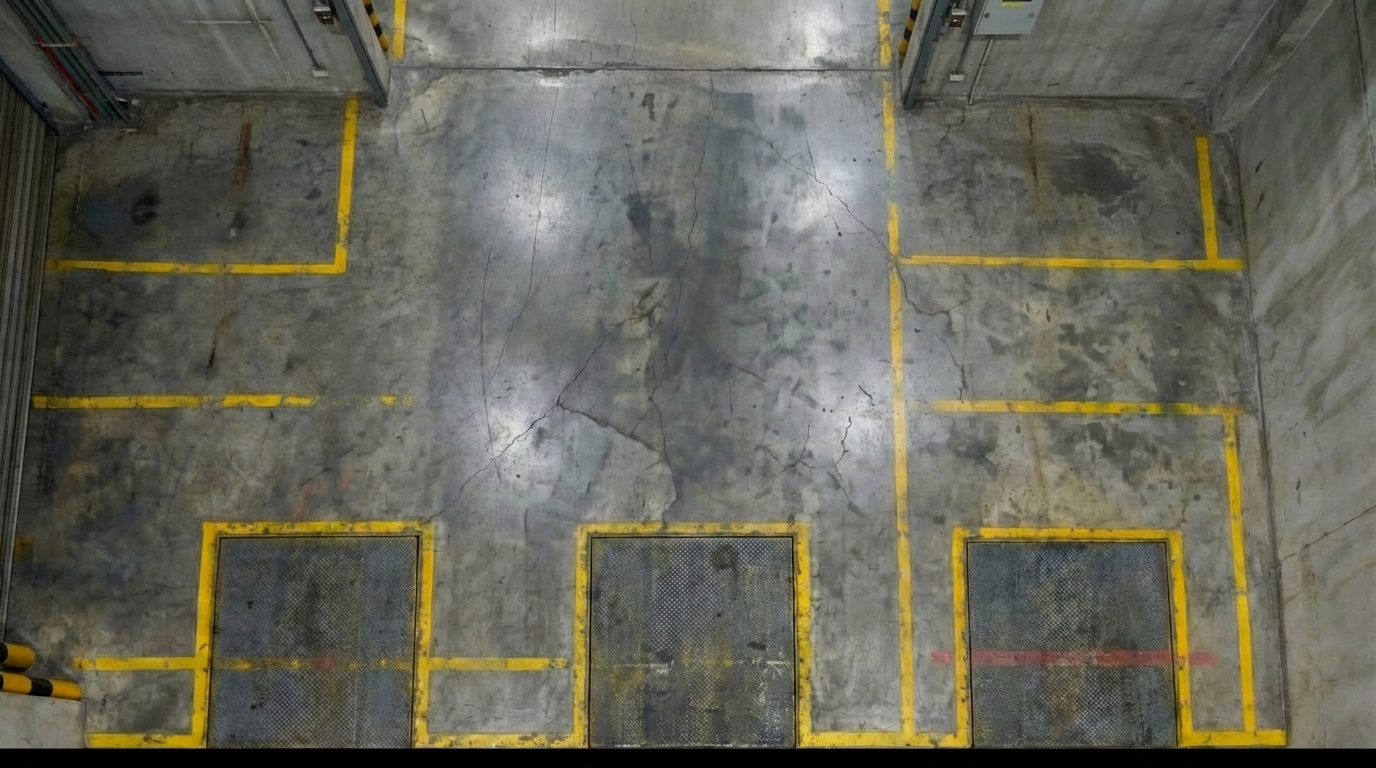
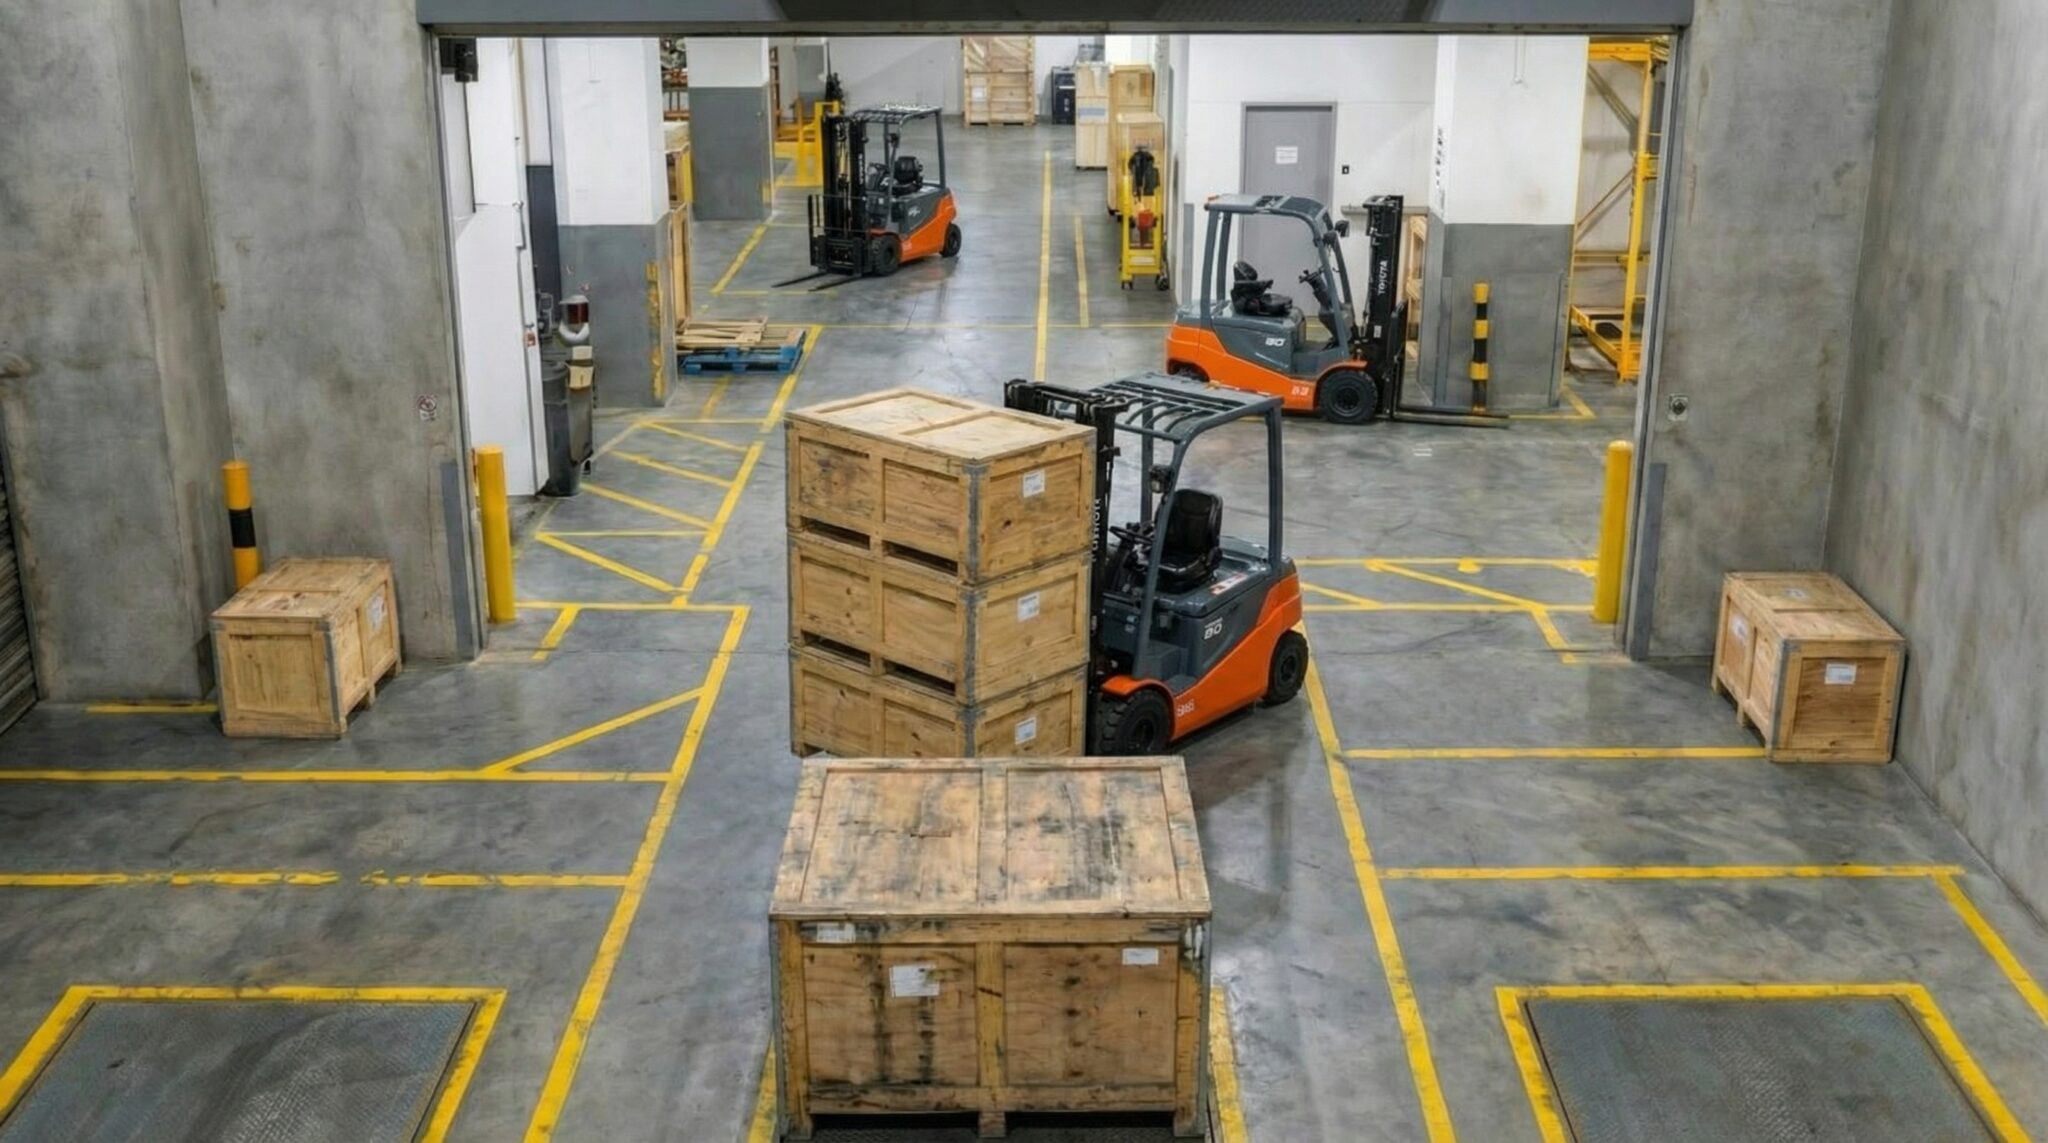
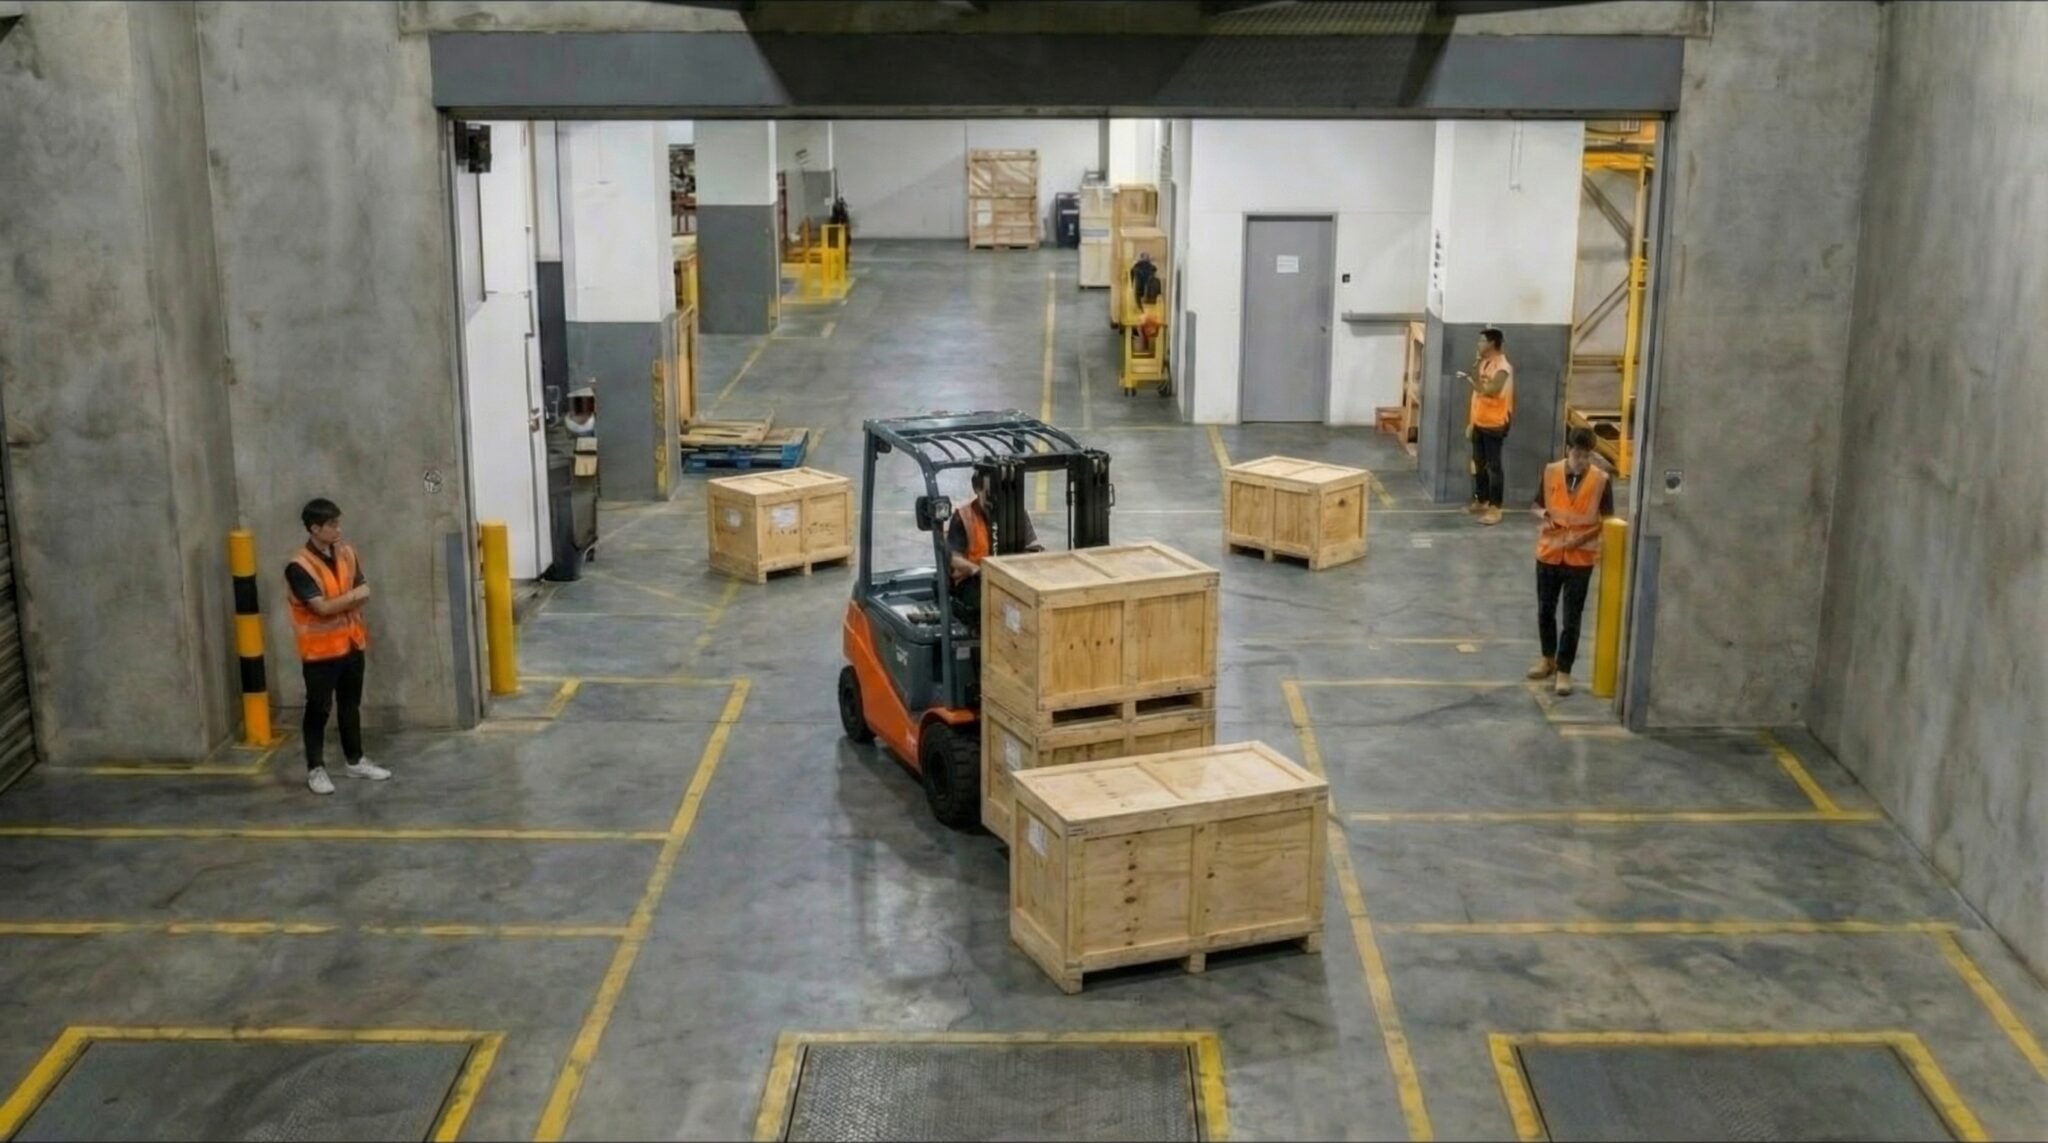
Problem
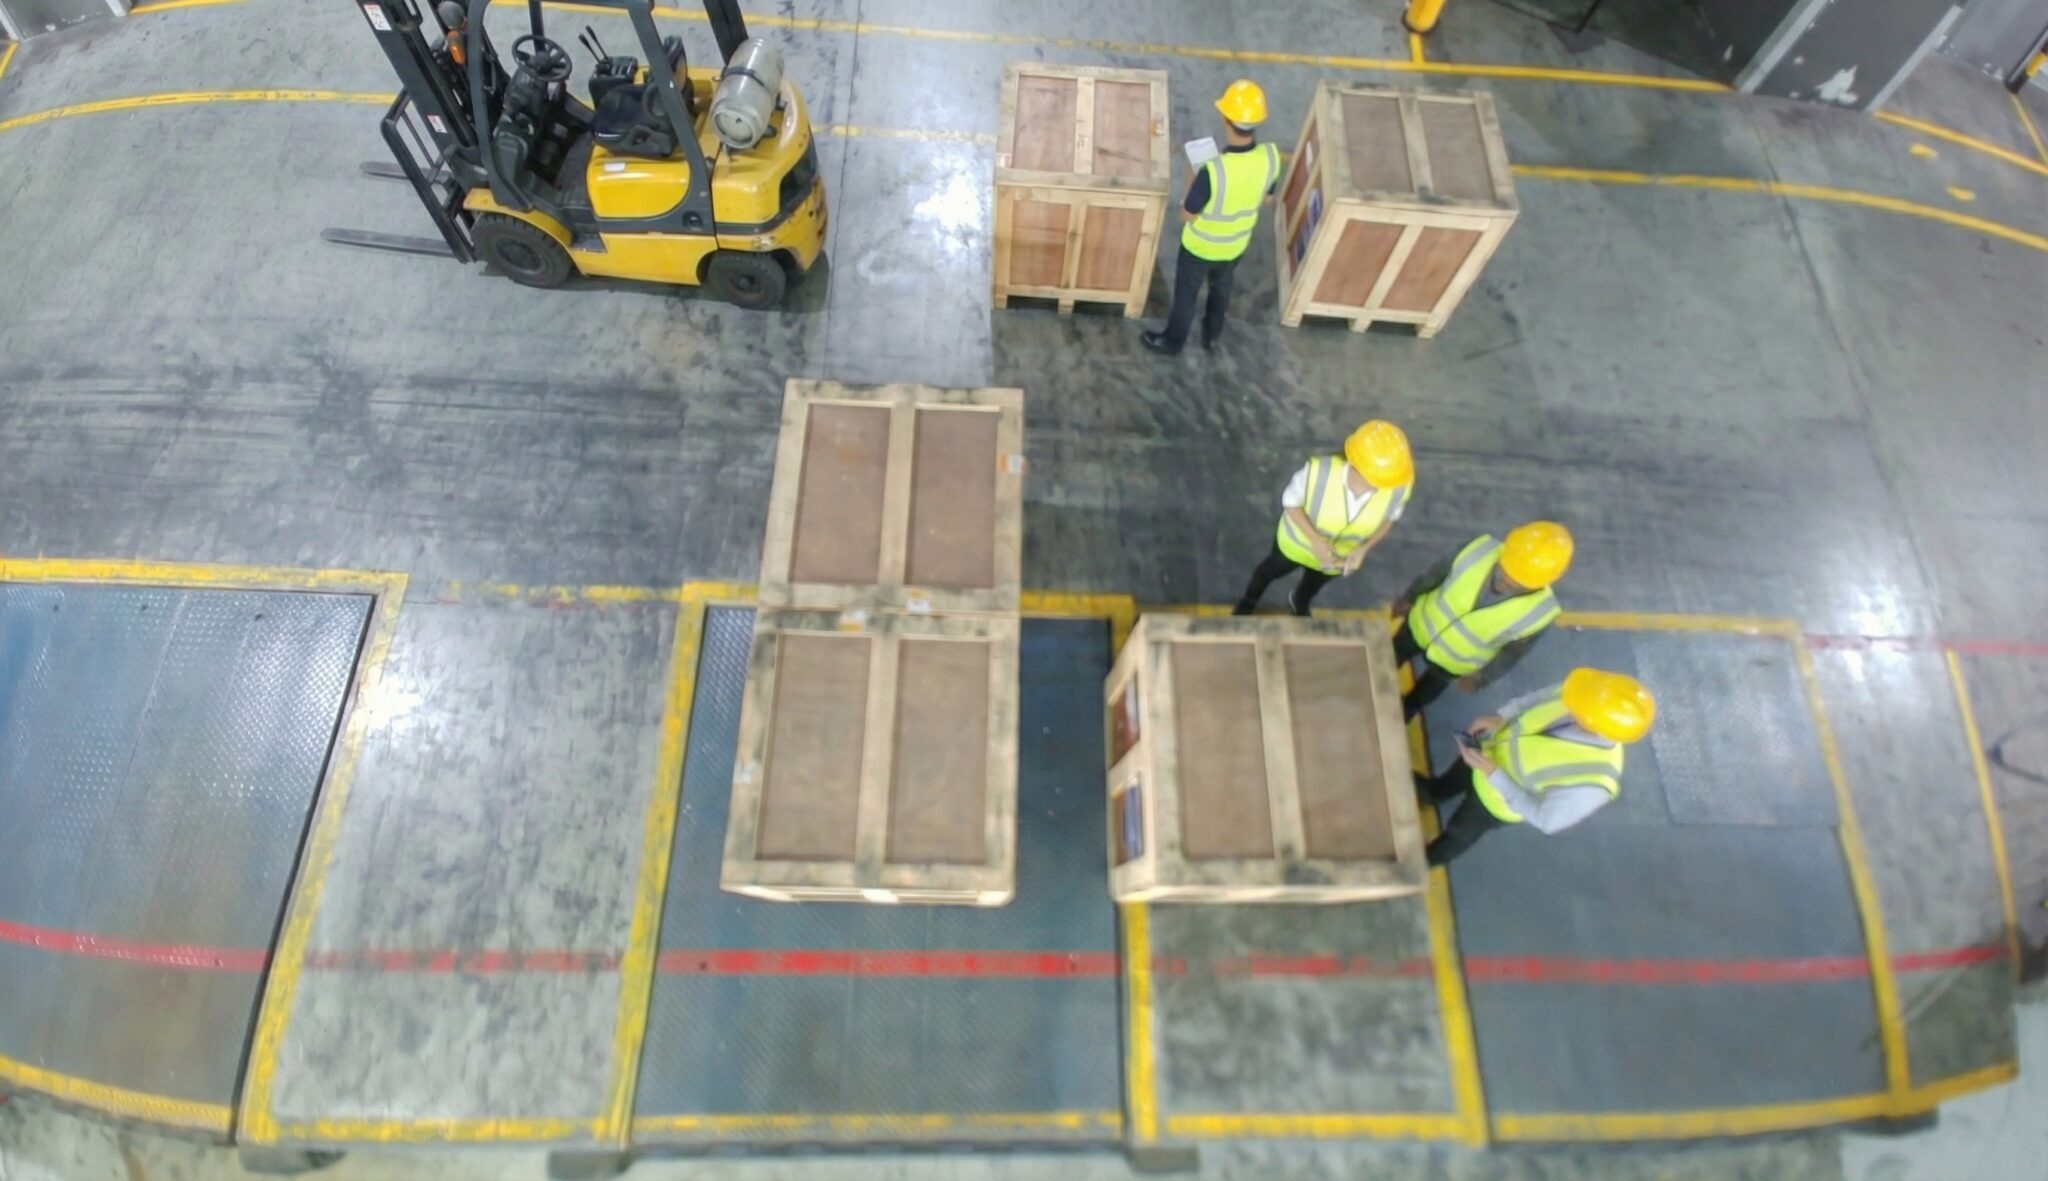
A safety incident such as crate toppling occurs due to SOP violations. The violation usually goes unnoticed until a customer files a complaint days later.
To identify the root cause, supervisors must watch hours of CCTV footage. This is a tedious process that consumes up to 8 hours
Under intense pressure to respond to customers promptly, supervisors must interview staff and draft formal reports. The entire reactive resolution process typically drags on for two full days before the case can be resolved
"How do we automate SOP violation detection for DSV warehouse supervisors to improve violation
visibility and response time as well as reduce manual effort in tracing back accidents?"
Our Solution
SafeSight combines a Raspberry Pi–based AI camera system, computer vision models for detecting crate stacking violations, and a user interface with a Power BI dashboard, while sending instant WhatsApp notifications for real-time alerts.
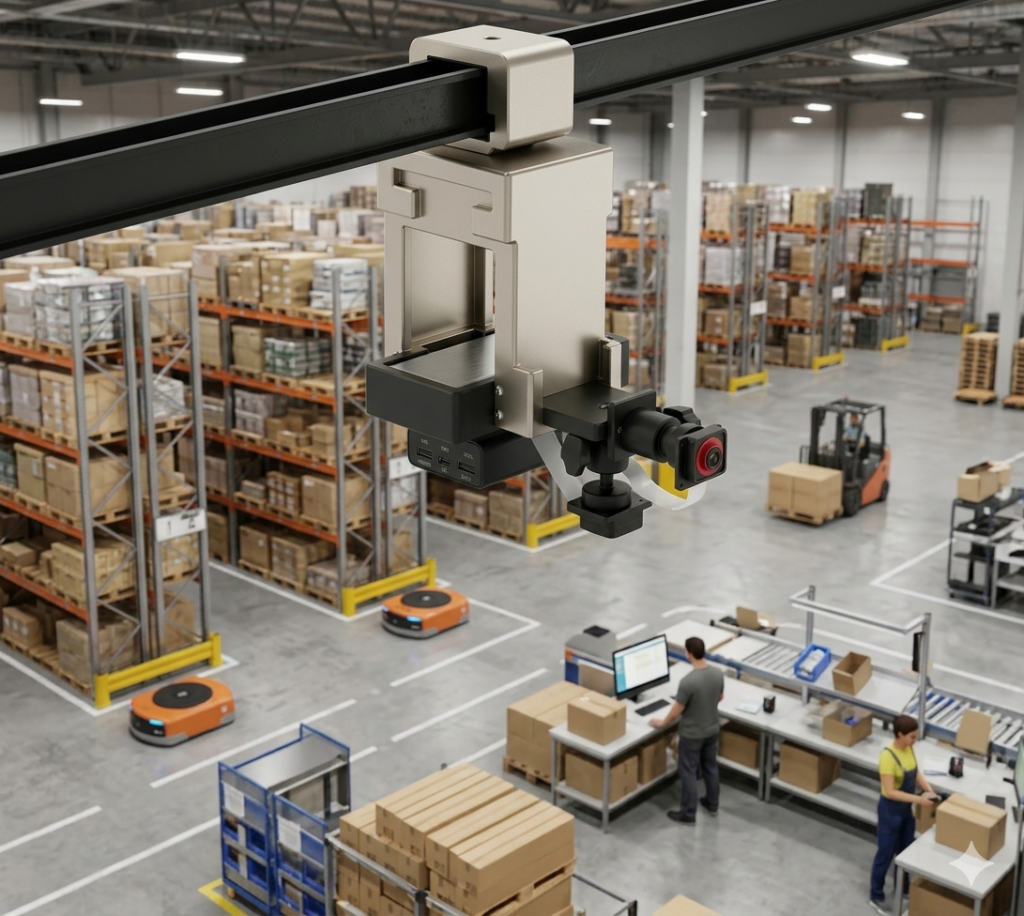
Hardware
Physical shell, embedded compute with Rasberry Pi and two Raspberry Pi cameras and HAILO accelerator, and mounting mechanism for warehouse deployment.
Software
Synthetic data generation, annotation, training a YOLO-based OBB model to detect crate stacking violations using rule-based algorithms. Detected violations trigger instant WhatsApp notifications to supervisors.
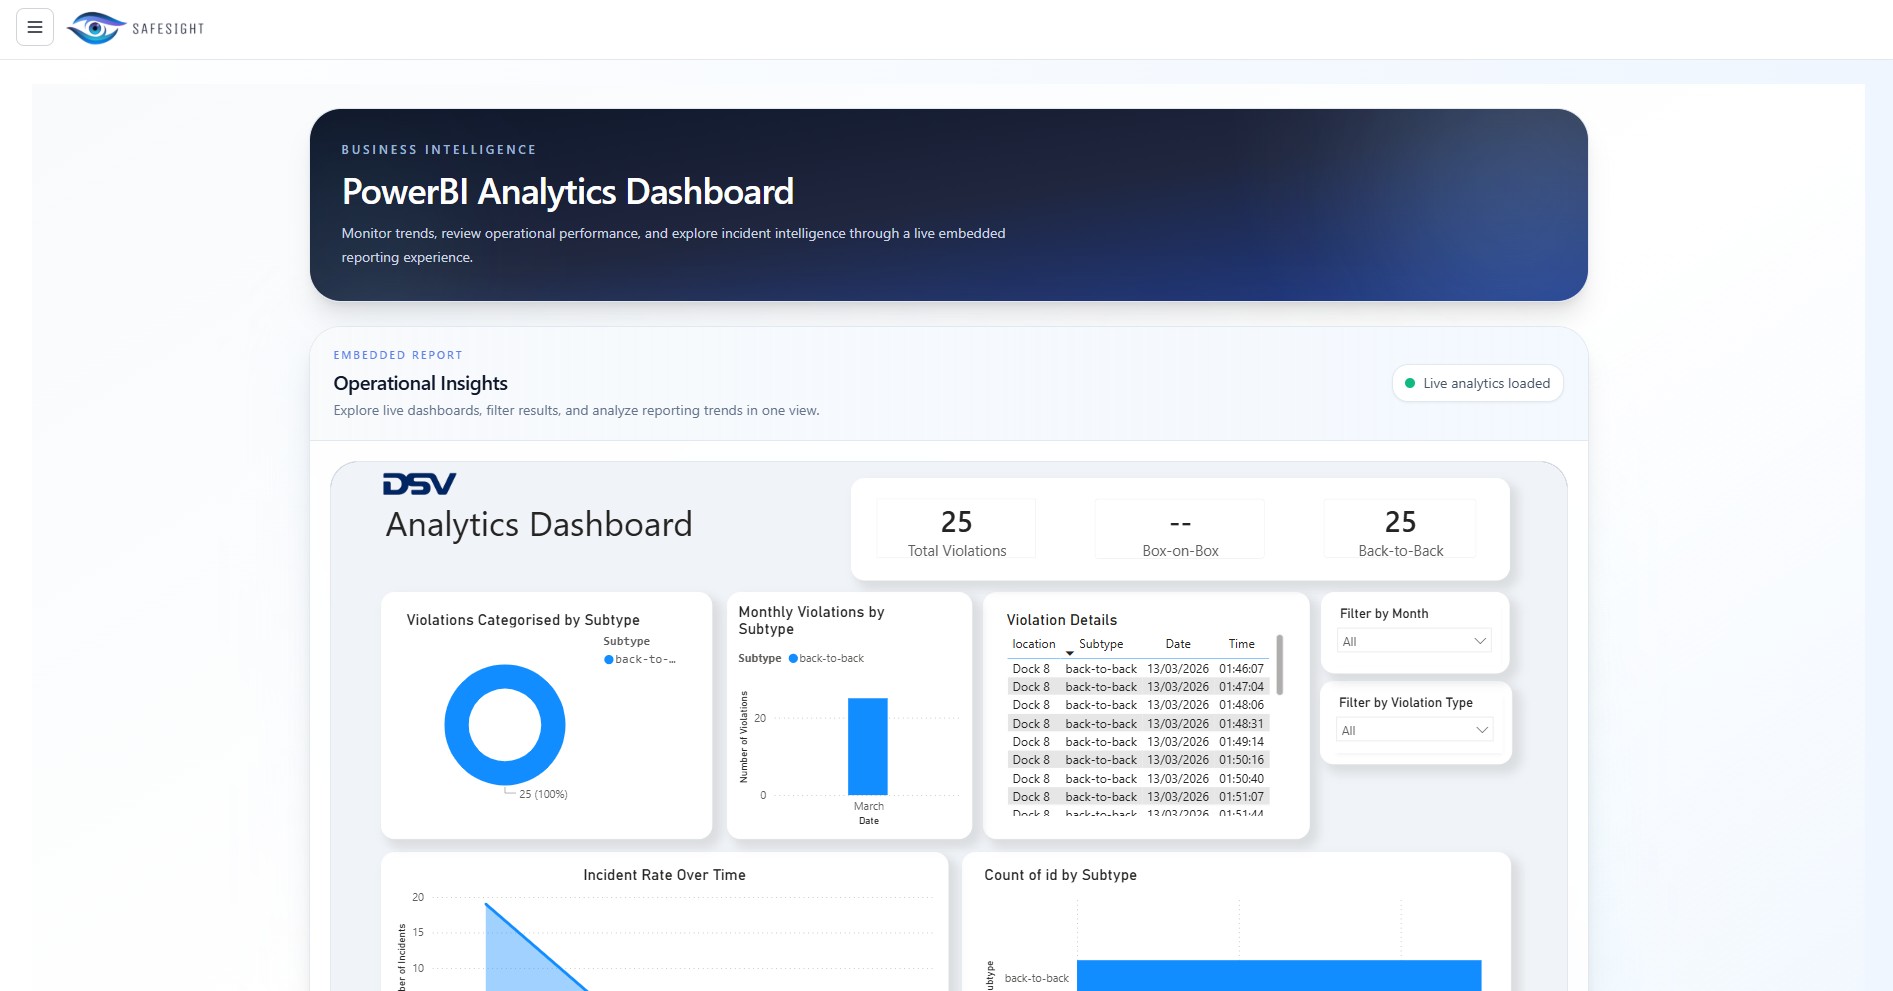
User Portal
Presents detected violations in a clear, user-friendly interface, allowing easy access and reviewing of incidents. An integrated Power BI dashboard provides analytics on warehouse performance based on recorded violations.
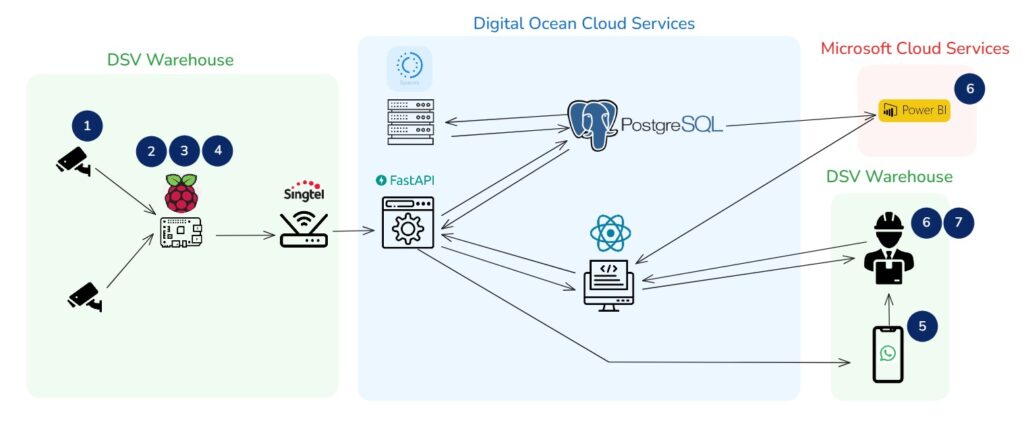
System Architecture
SafeSight follows an end-to-end workflow from camera capture to supervisor action.
1
Camera
Capture
2
On-device
Inference
3
Ruleset
Trigger
4
Event
Recording
5
Notification
WhatsApp Alert
6
Dashboard
Review
7
Reporting
Closure
Software Architecture Diagram
Hardware Design Iterations
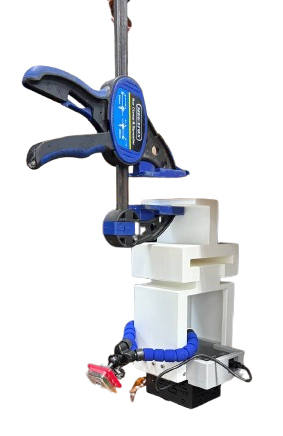
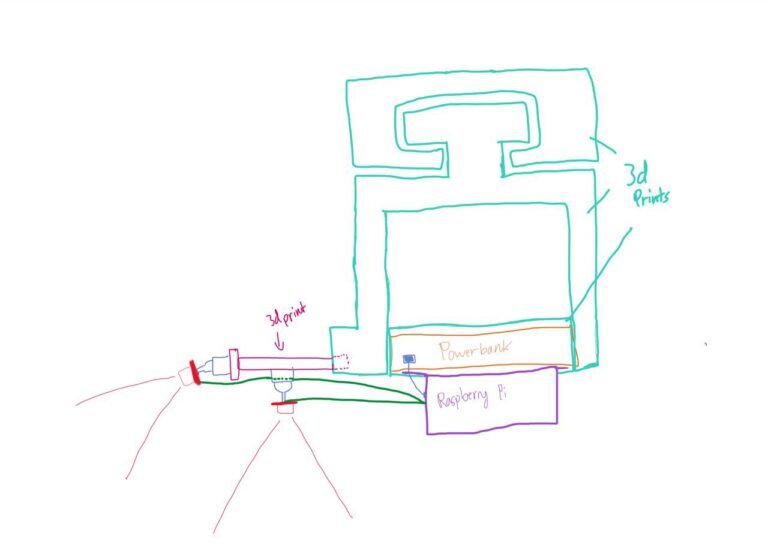
Iteration 1
The first hardware version was a bare Raspberry Pi with the camera module held in place by blue tack adhesive and a mini tripod stand that acted as a mount for the box-on-box stacking camera. Moreover, the whole mount was set up by a clamp which was functional for early testing but not suitable for deployment.
Drawing
Render
Actual
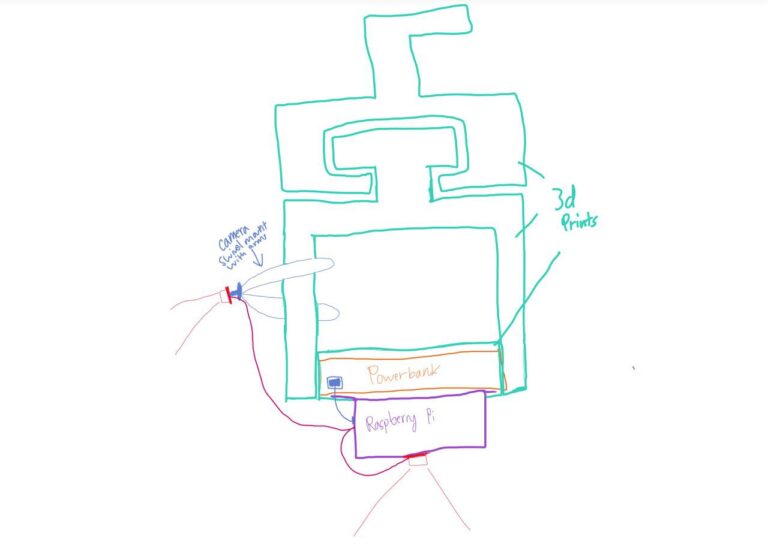
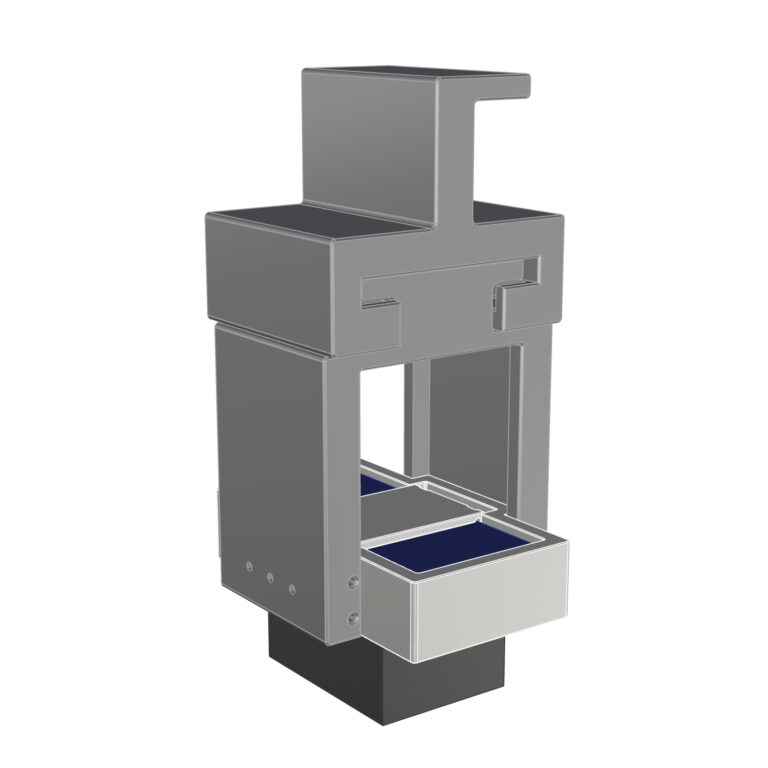
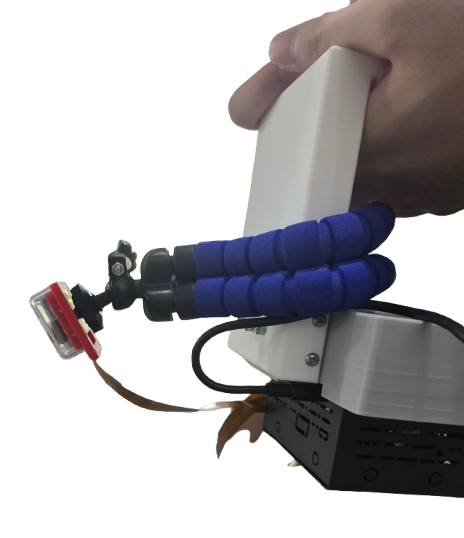
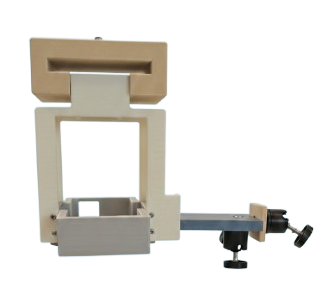
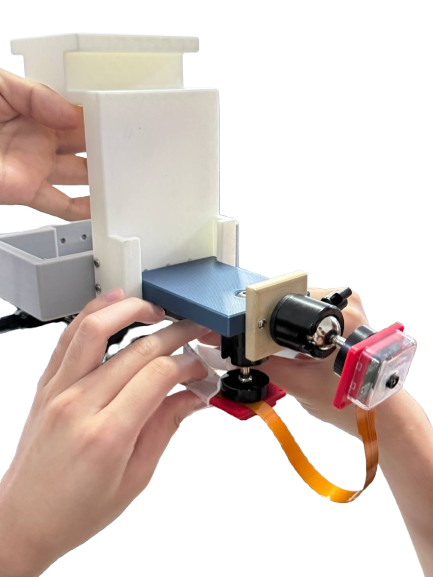
Iteration 2
Version 2 moved toward a formalized 3D-printed shell with integrated cable routing, a proper mounting bracket, and space for the HAILO accelerator. This made the system stable enough for real-world showcase and deployment.
Drawing
Render
Actual
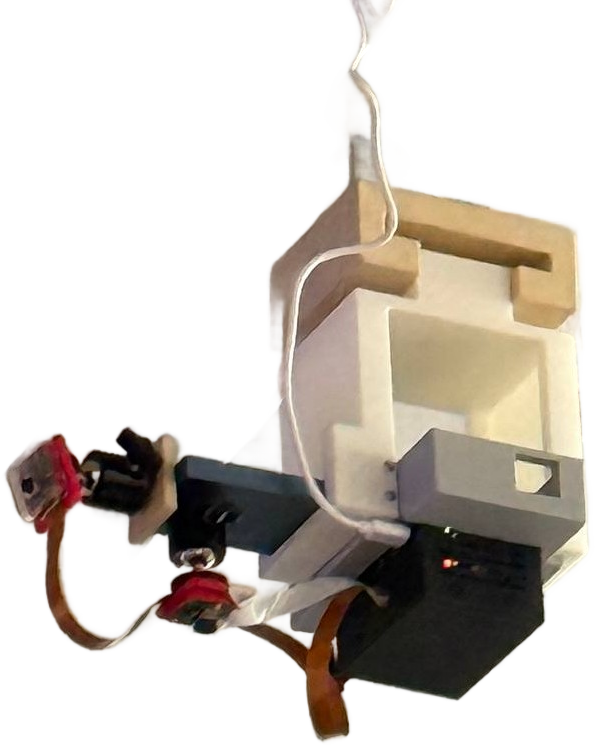
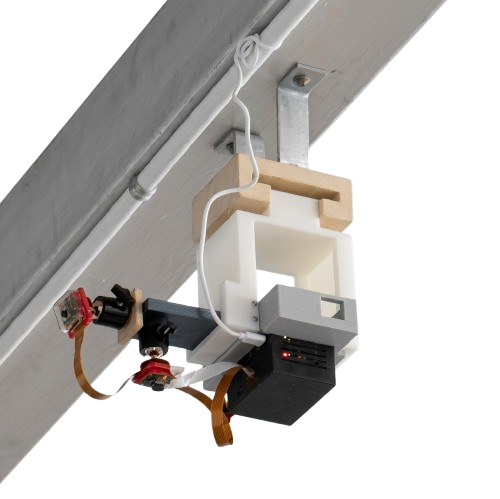
Final Deployed Prototype
Closeup of Prototype
Set up at site
Software Design Iterations
SafeSight improved through multiple rounds of iteration across data, inference performance, and hardware deployment.
Data Iteration
The team initially faced a significant lack of warehouse CCTV footage capturing the target violations. Hence, we were unable to start working on our Computer Vision algorithms. To address this, synthetic data was generated early on using Google’s Nano Banana for images and Google Veo for videos.
1
Creating Camera Angles
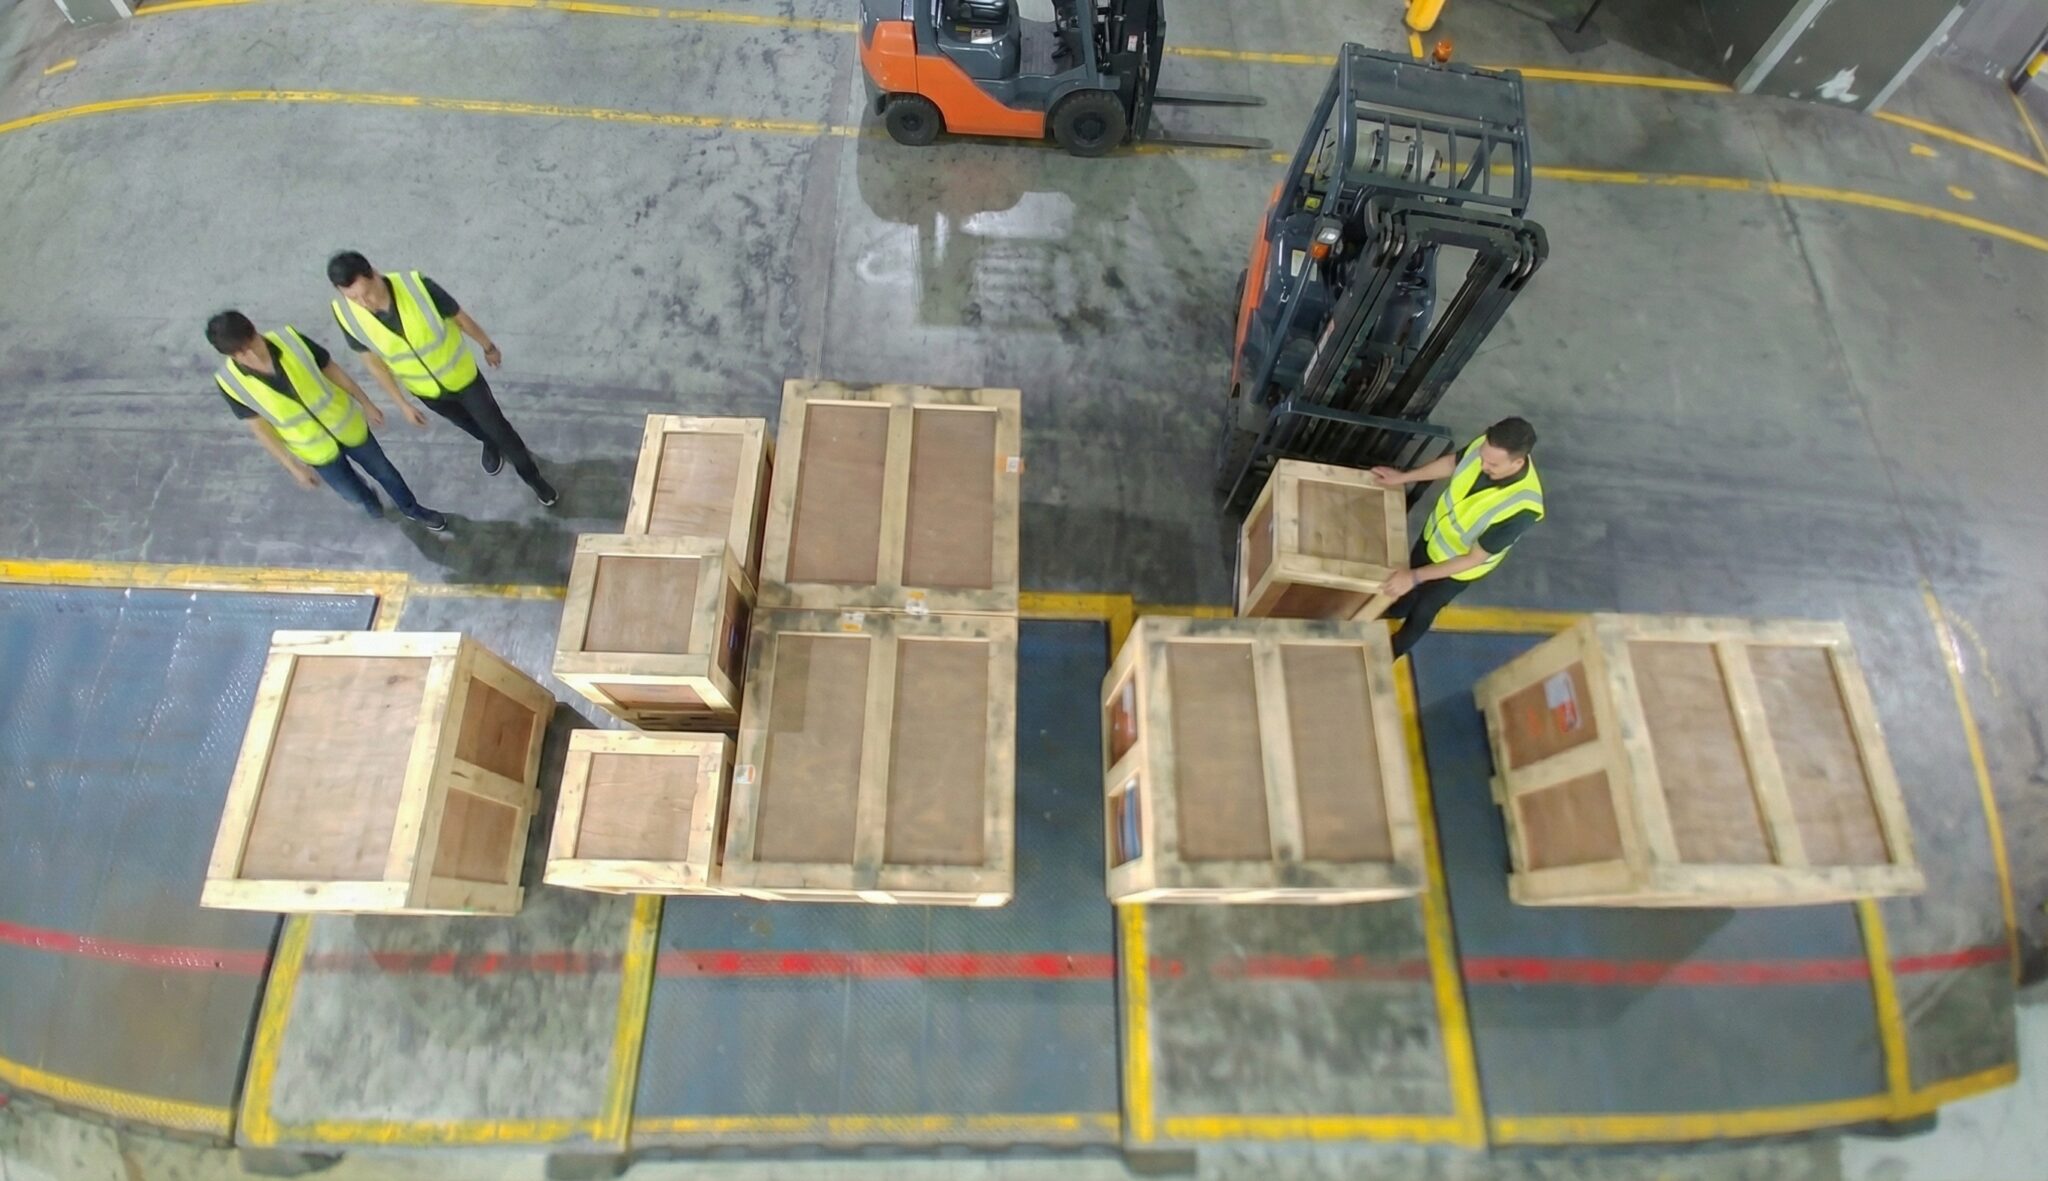
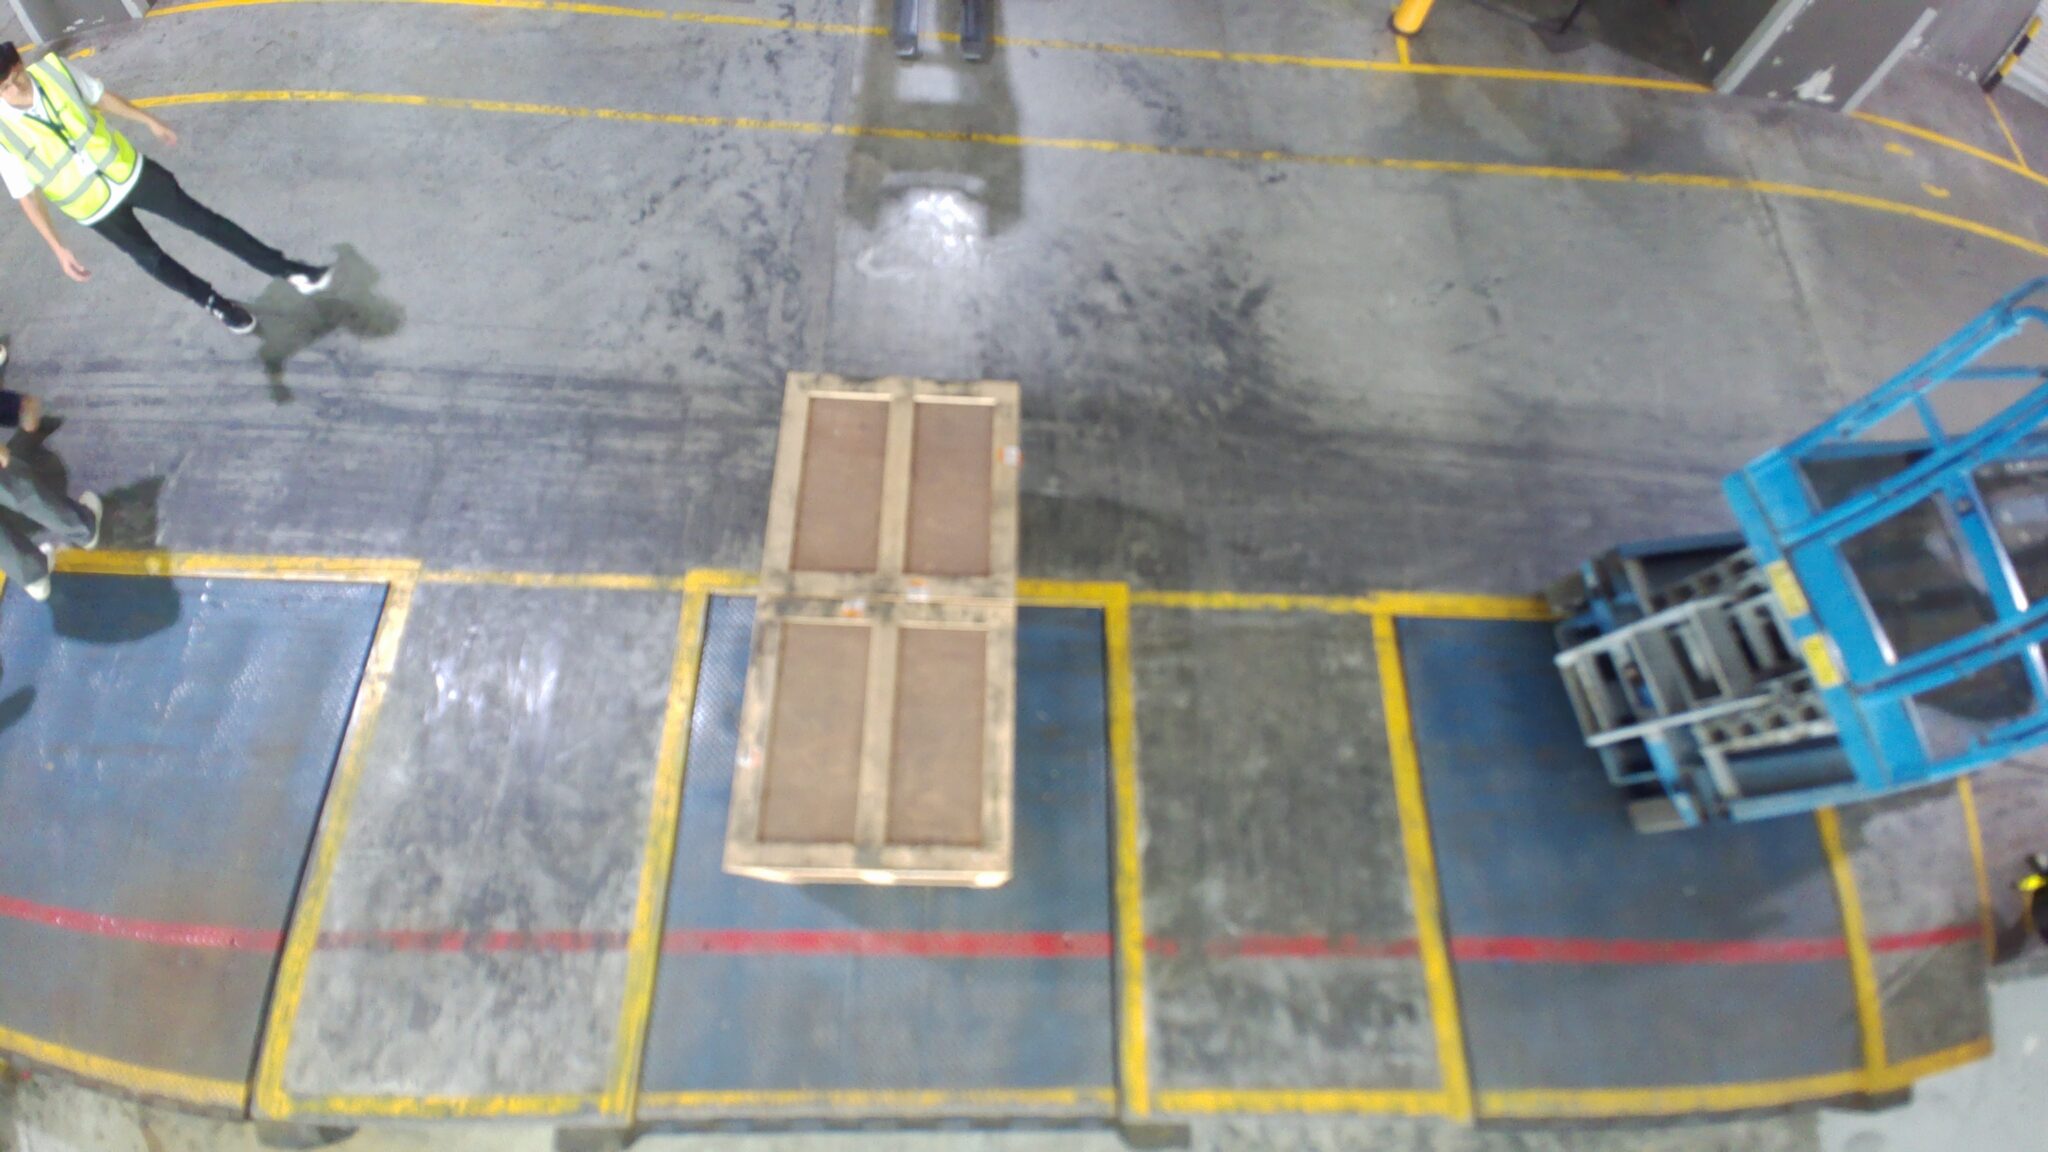
As we lacked images from the required camera angles—top view for detecting back-to-back stacking and door view for box-on-box stacking—we used NanoBanana to generate synthetic data for these specific perspectives.
2
Generating Violation Images and Videos
We then used NanoBanana to generate synthetic violation data of back to back and box on box crate stackings, producing imagesfor training our YOLO-based OBB models and videos for testing.
3
Refining Synthetic and Real Data
Synthetic data alone did not capture the full range of lighting conditions or the specific packaging used at DSV, resulting in poor bounding box performance across different crate types. To address this, we used our first prototype to collect real images and augment the training set. Combining live and synthetic data improved the model’s bounding box accuracy.
Data Annotation
To annotate the raw dataset, the platform Roboflow was used, leveraging its SAM 3 segmentation model to assist in labeling objects. This enabled efficient identification and outlining of key elements such as crates and forklifts through visual segmentation. The model helped automate much of the annotation process, reducing manual effort while maintaining consistency across the dataset, which ultimately improved the quality of training data for our YOLO-based OBB model.
Annotated Data
Annotated Data
Model Iteration
We then applied our YOLO-based OBB models using the refined dataset and implemented rule-based logic to detect violations. However, performance was limited on the Raspberry Pi, requiring further optimization due to reduced inference capability.
Box-on-Box Stacking
Back-to-Back Stacking
1
Version 1
Early edge deployment encountered latency constraints on the Raspberry Pi alone, running at only 3-5 FPS which made the system impractical for real-time monitoring.
2
HAILO Accelerator
Introducing the HAILO-8 AI accelerator module improved inference performance to 18-20 FPS with 10x lower latency, making the system responsive enough for live violation detection.
3
Improved OBB Model
The model still struggled to accurately predict OBB boxes, requiring further refinement of the training dataset. Performance was ultimately improved by adopting a more advanced YOLO OBB model from Data Iteration 3, leading to better inference results.
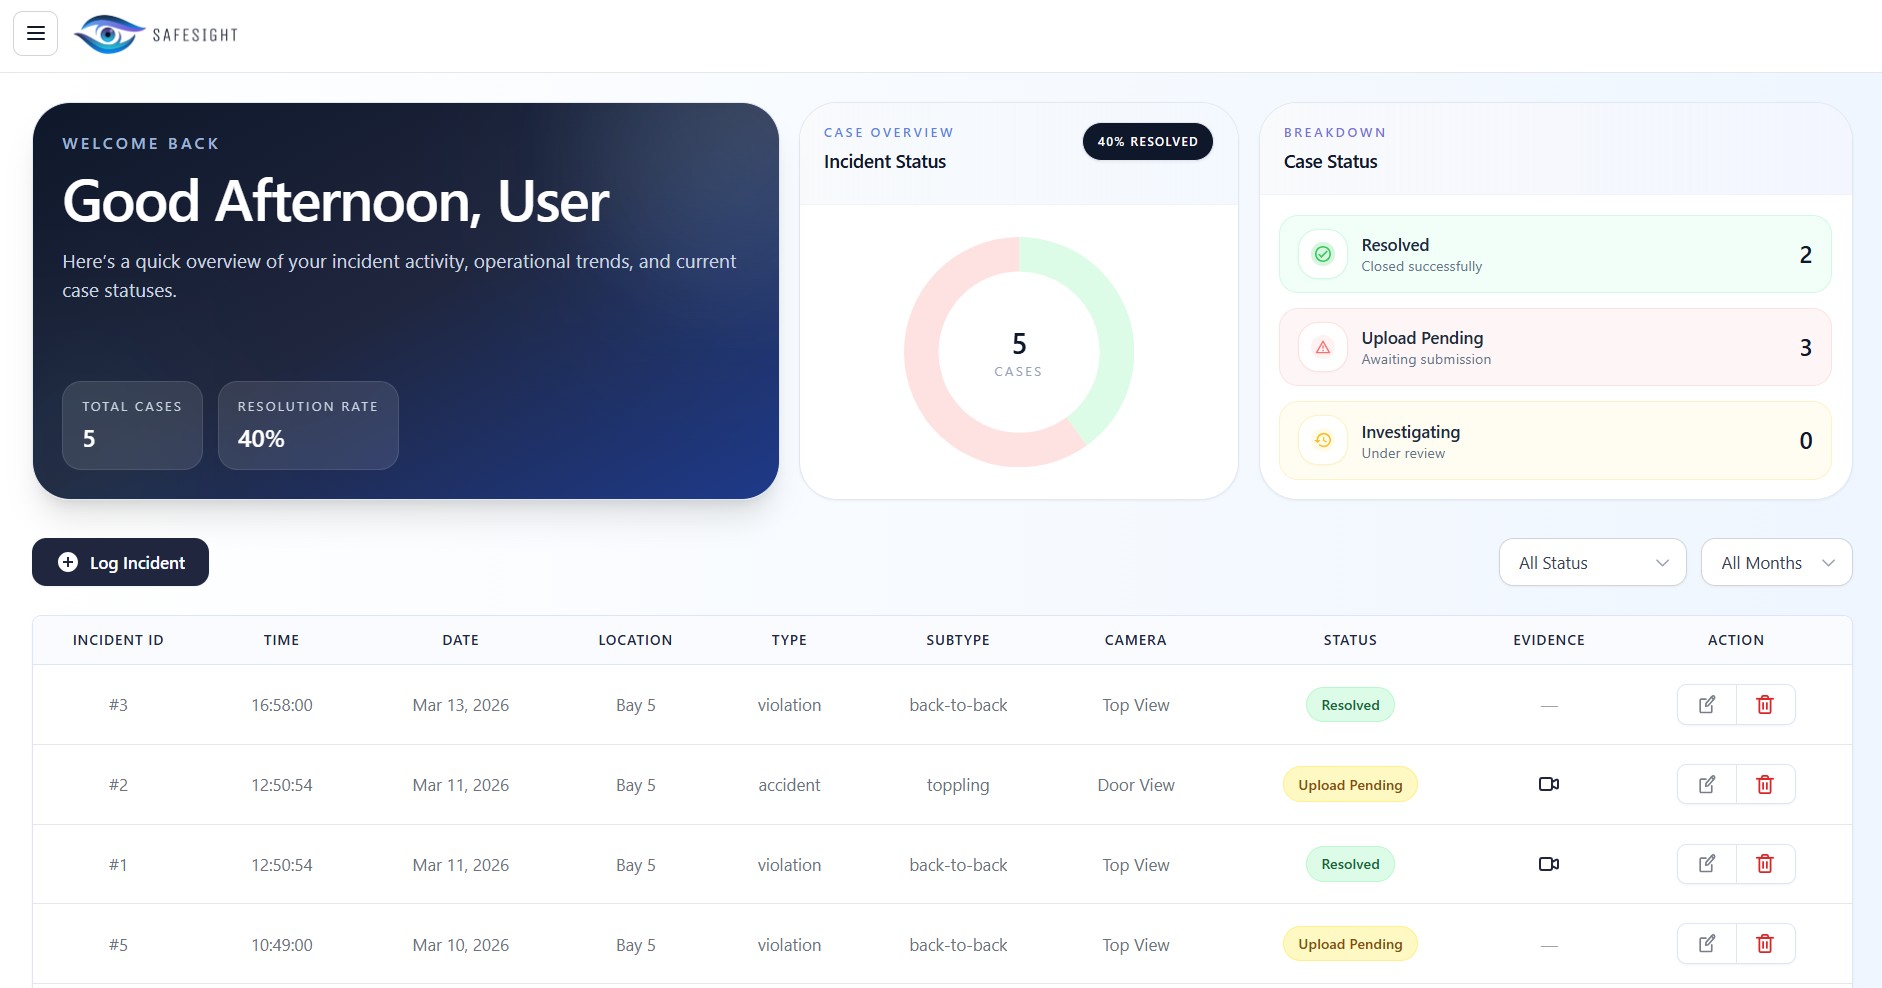
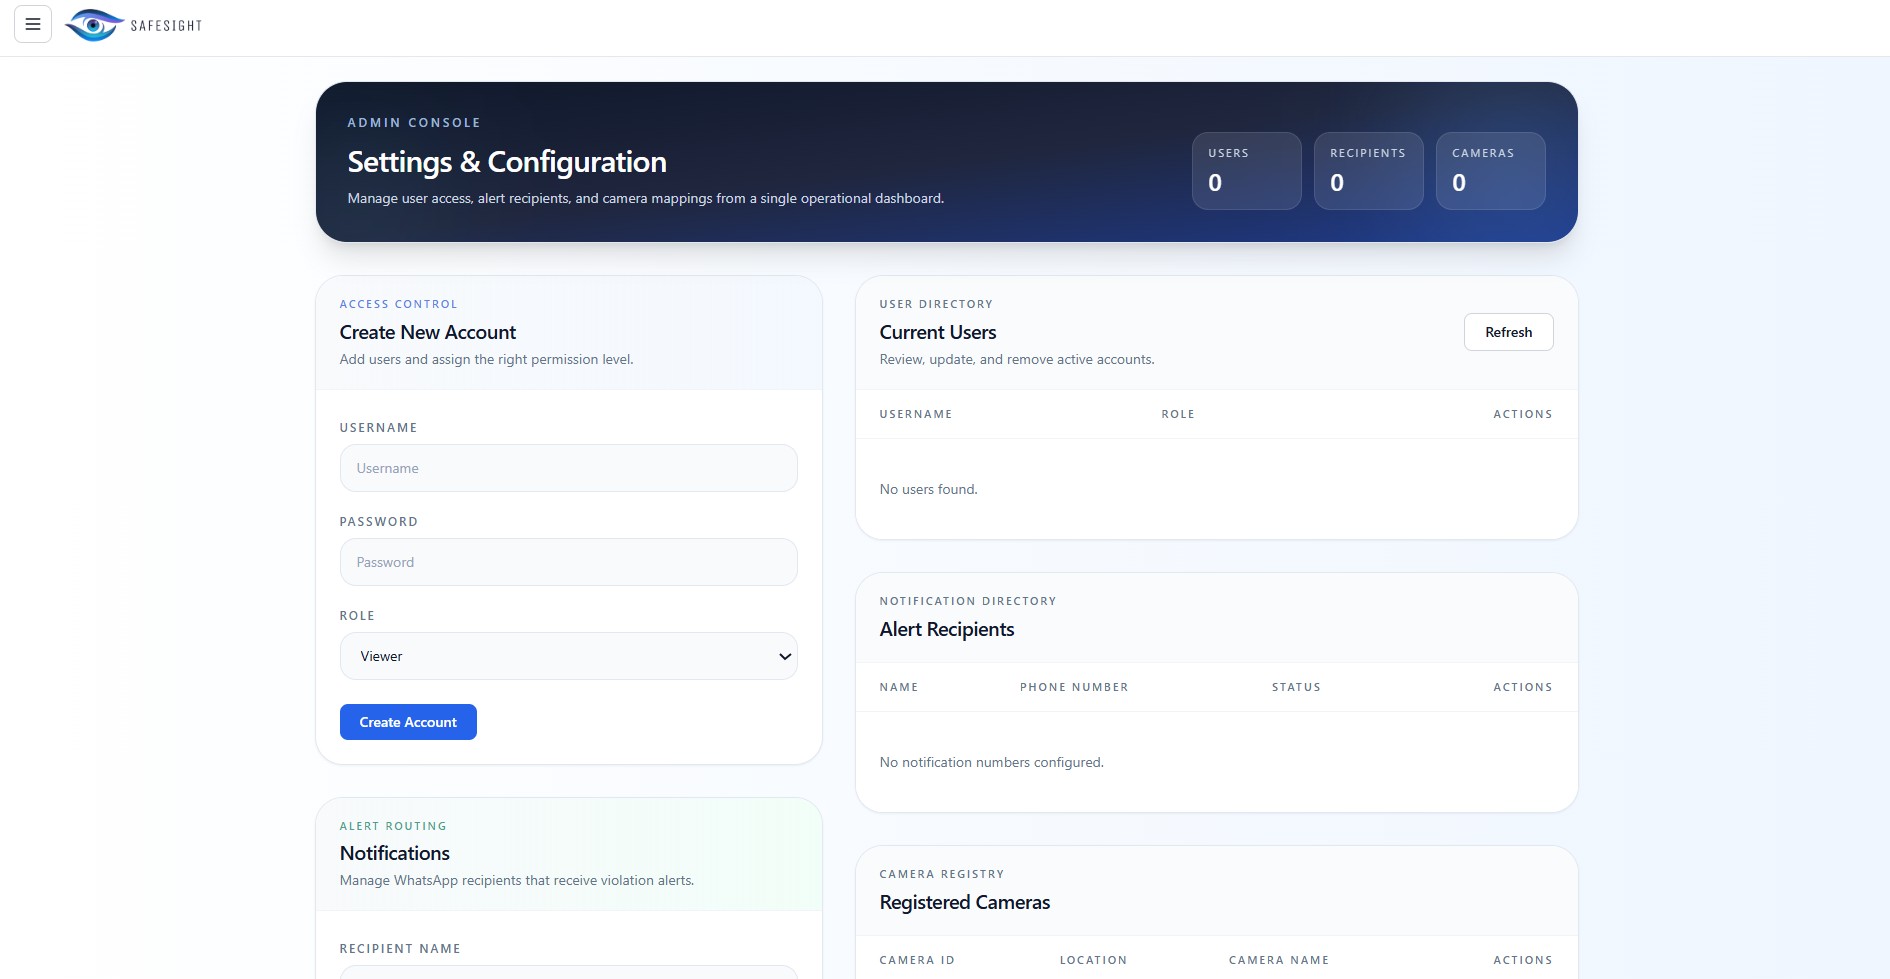
User Portal Iterations
The user portal acts as the operational hub for SafeSight after an event has been detected.
1
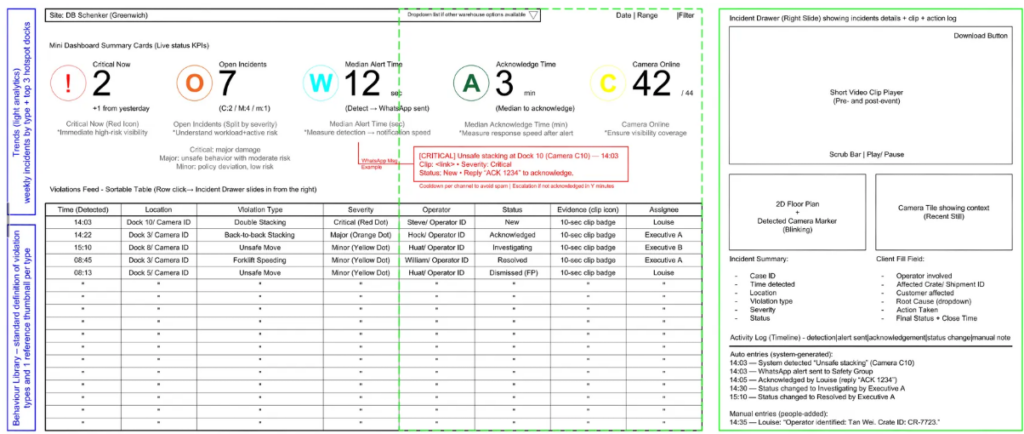
Initial Rough Mockup
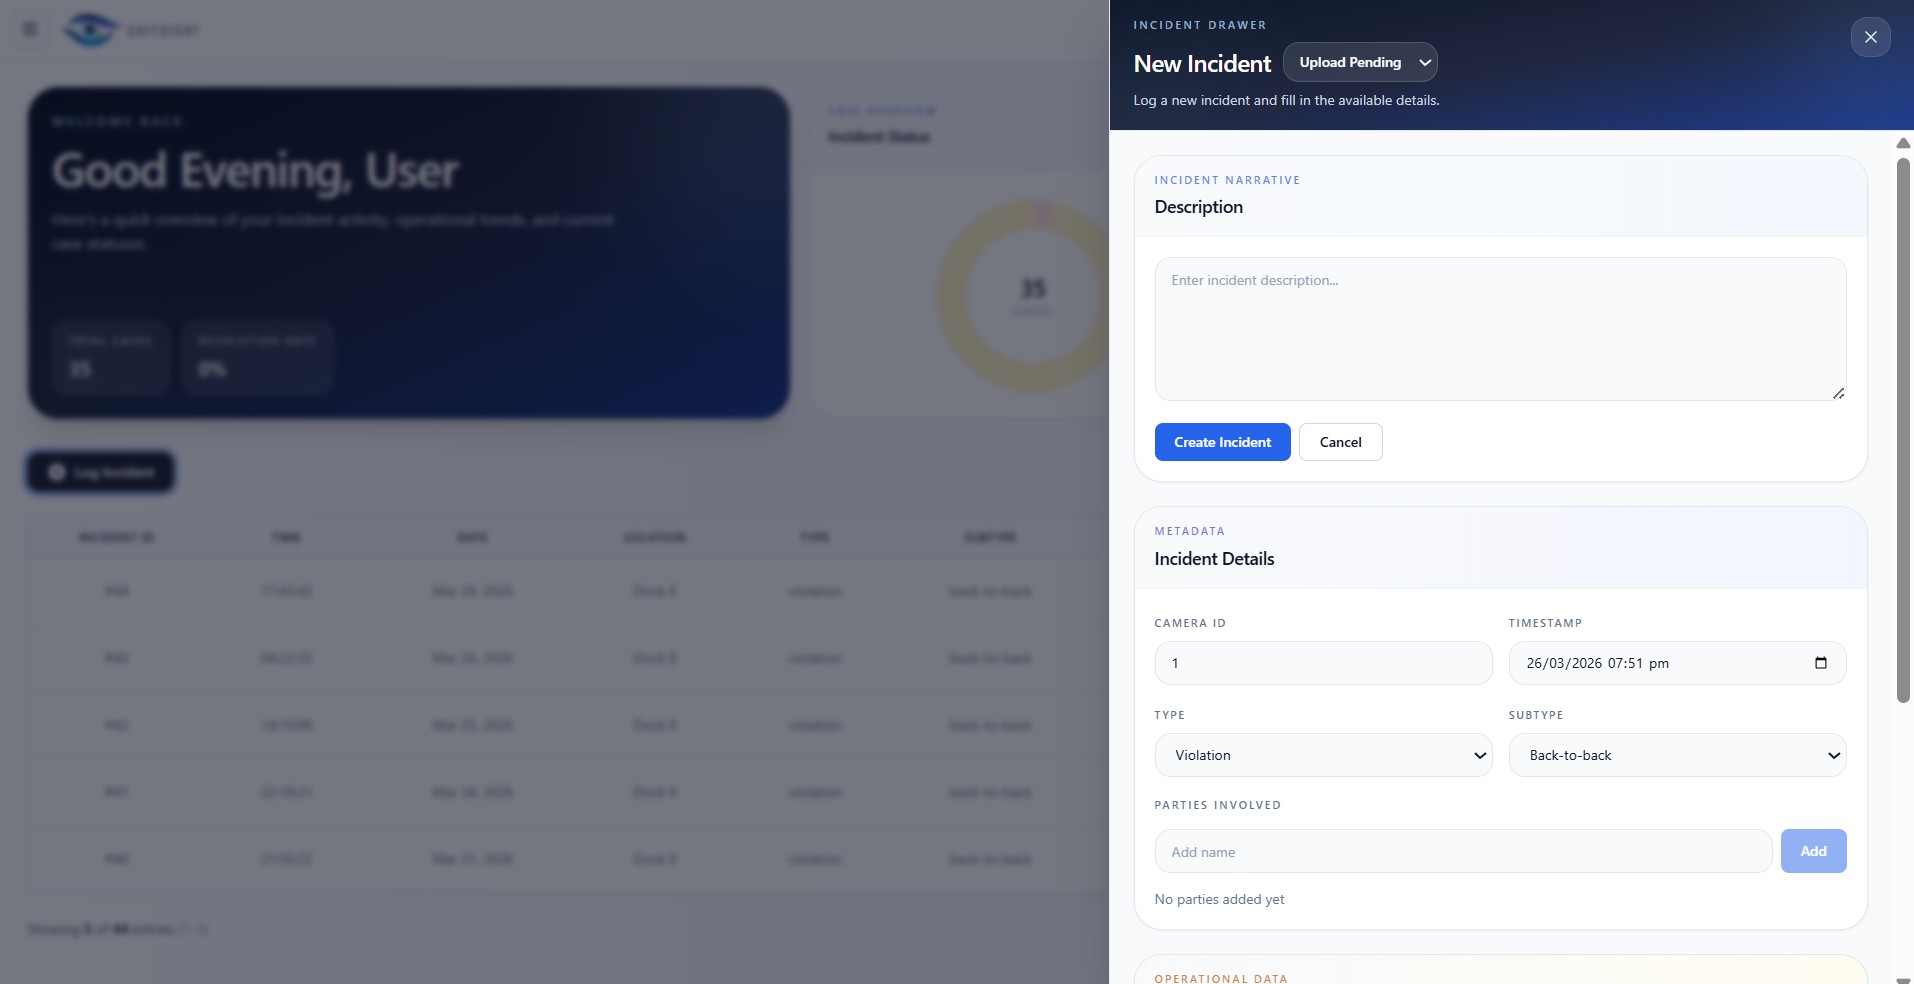
An initial mockup was made based on user requirements with the base pages including a incident grid and an incident drawer to review specific incidents.
2
Figma Prototype
The mockup was then translated into a mid-fidelity Figma Prototype.
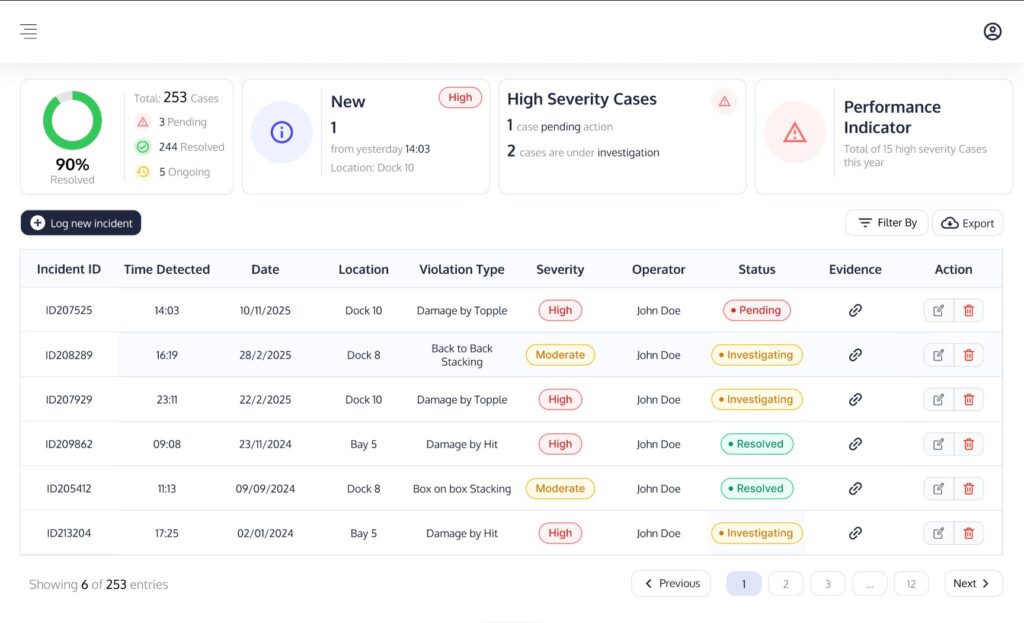
3
Final User Portal
The whole user experience was later revamped to make the whole incident reviewing experience conclusive and seamless with the addition of a settings page and an integrated PowerBI Dashboard.
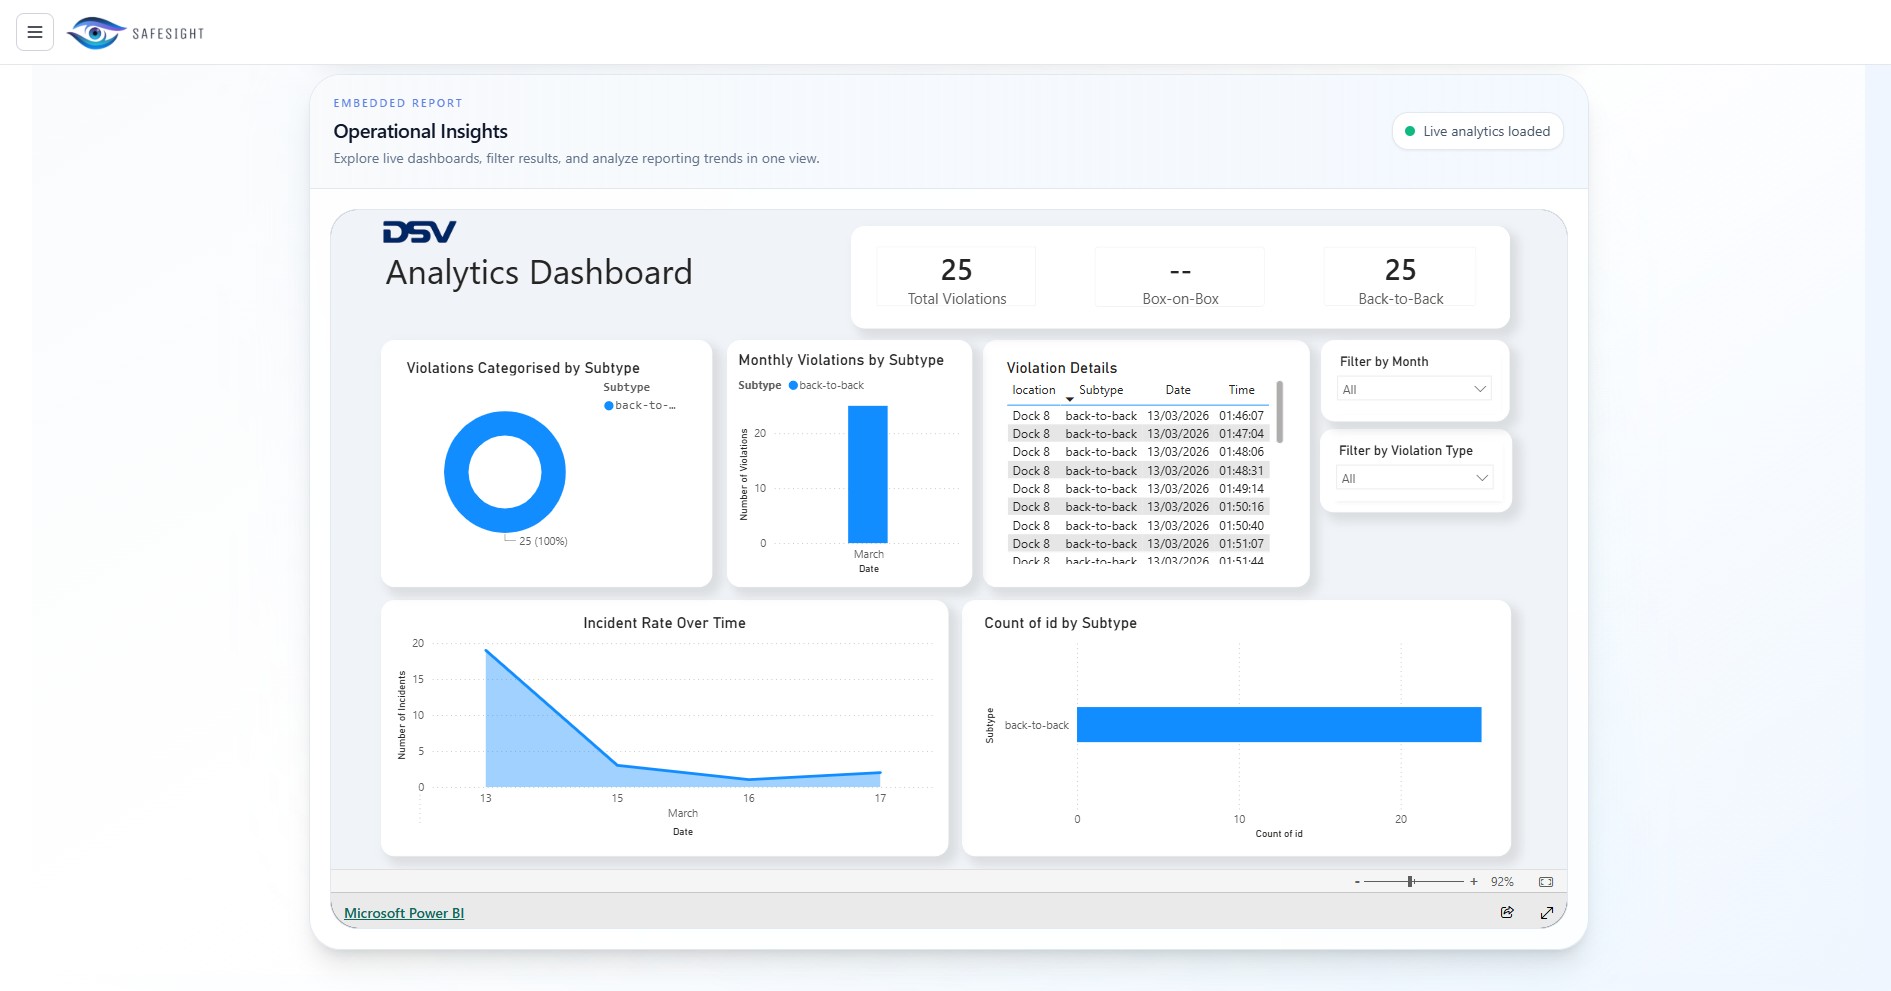
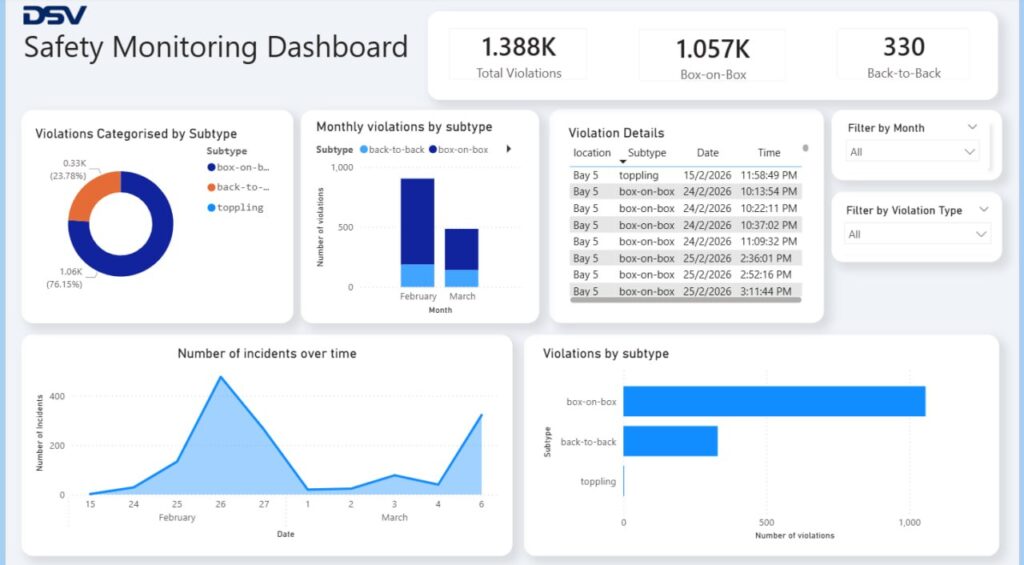
Integrated PowerBI Dashboard Iterations
The Power BI dashboard provides warehouse supervisors with an analytics view of violations detected by SafeSight—categorized by time, location, and type—offering actionable insights into overall warehouse performance.
1
Iteration 1
The first iteration lacked visual polish and included several unnecessary fields that were not needed for our proof of concept.
2
Revised Dashboard
The revised version was refined to better meet the needs of DSV supervisors and redesigned with a cleaner, more modern interface.
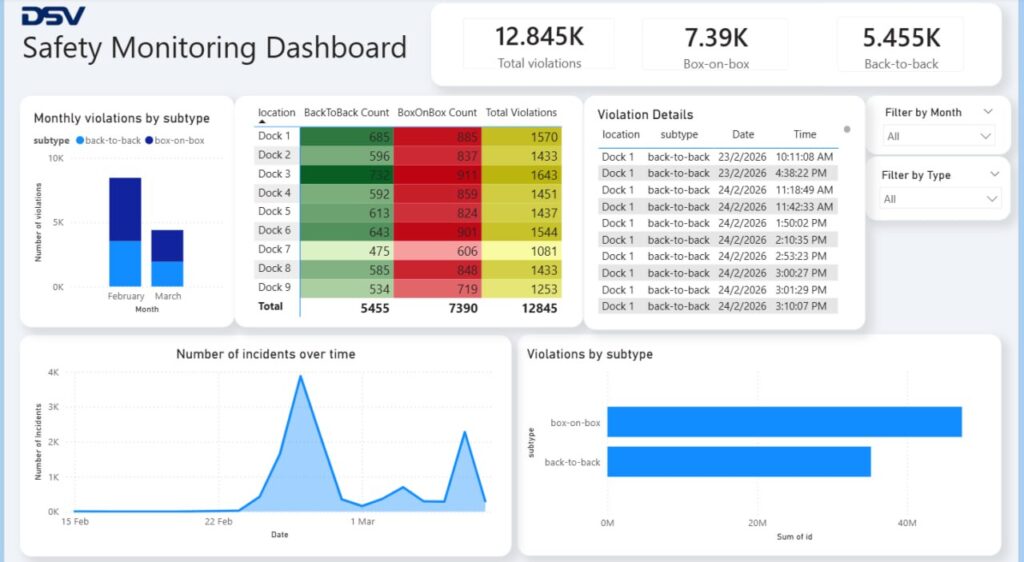
3
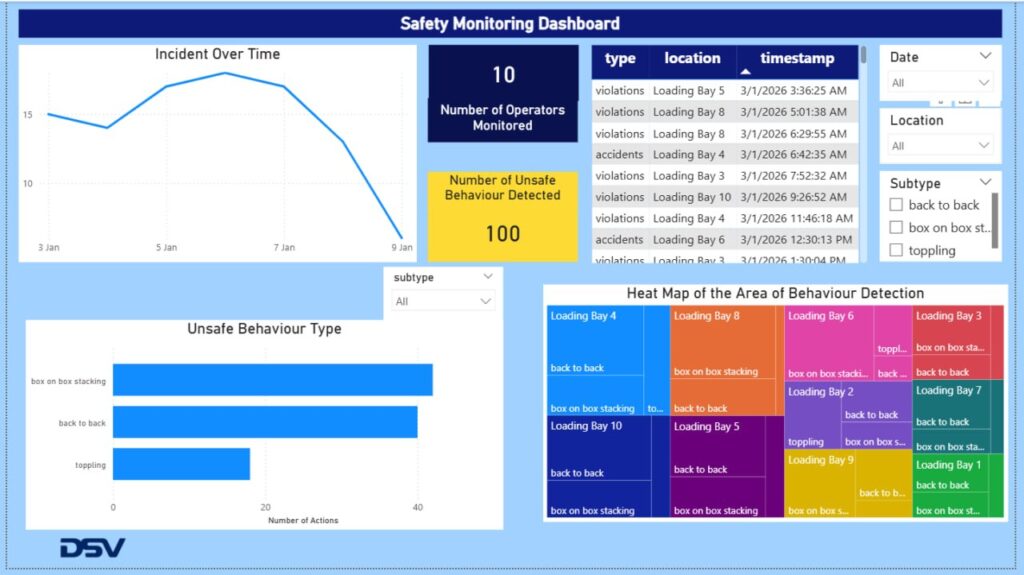
Demo Dashboard
The team also developed a demo dashboard illustrating how the system would scale and appear in the future as more cameras are deployed at different locations across the warehouse.
How it Works
SafeSight supports two connected user experiences. Use the slideshow below to walk through each flow.
Flow A
Real-Time Responses
1
Camera Monitors Activity
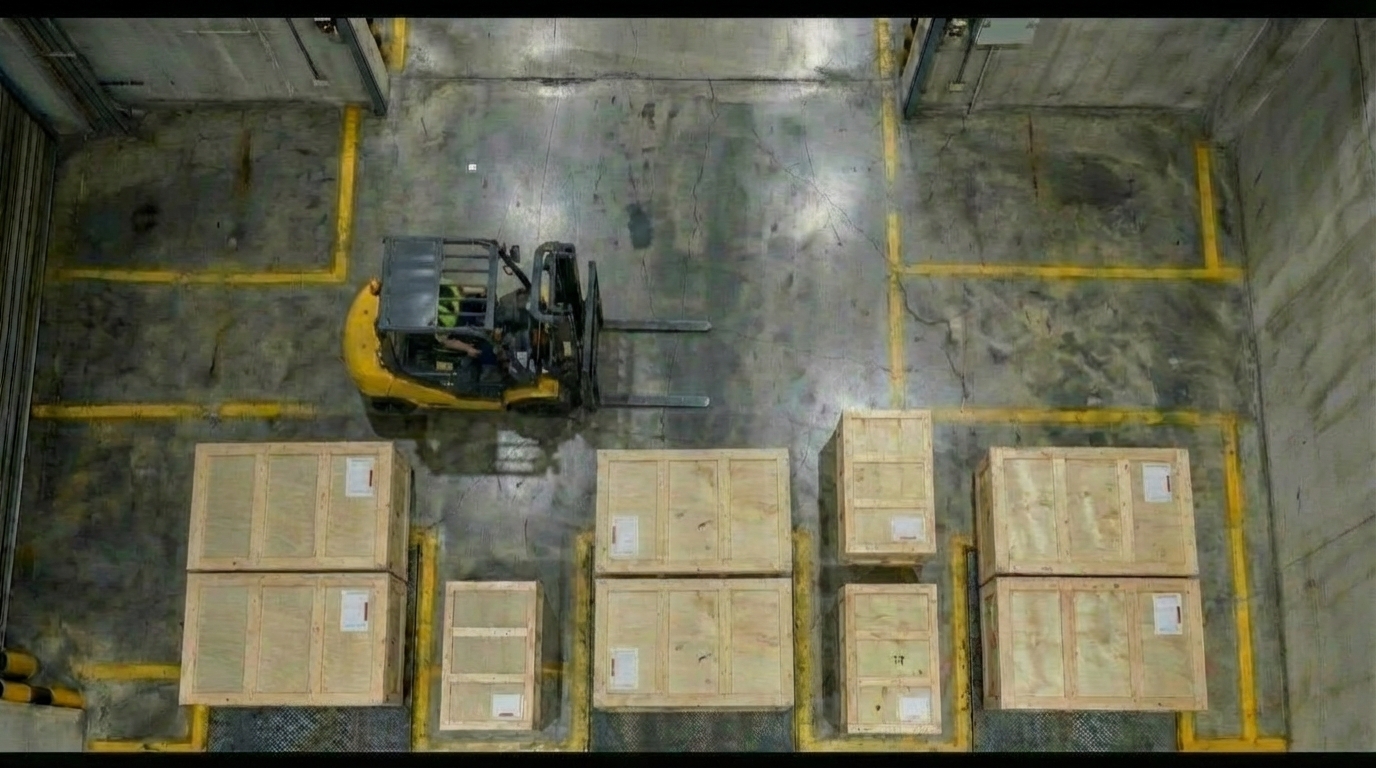
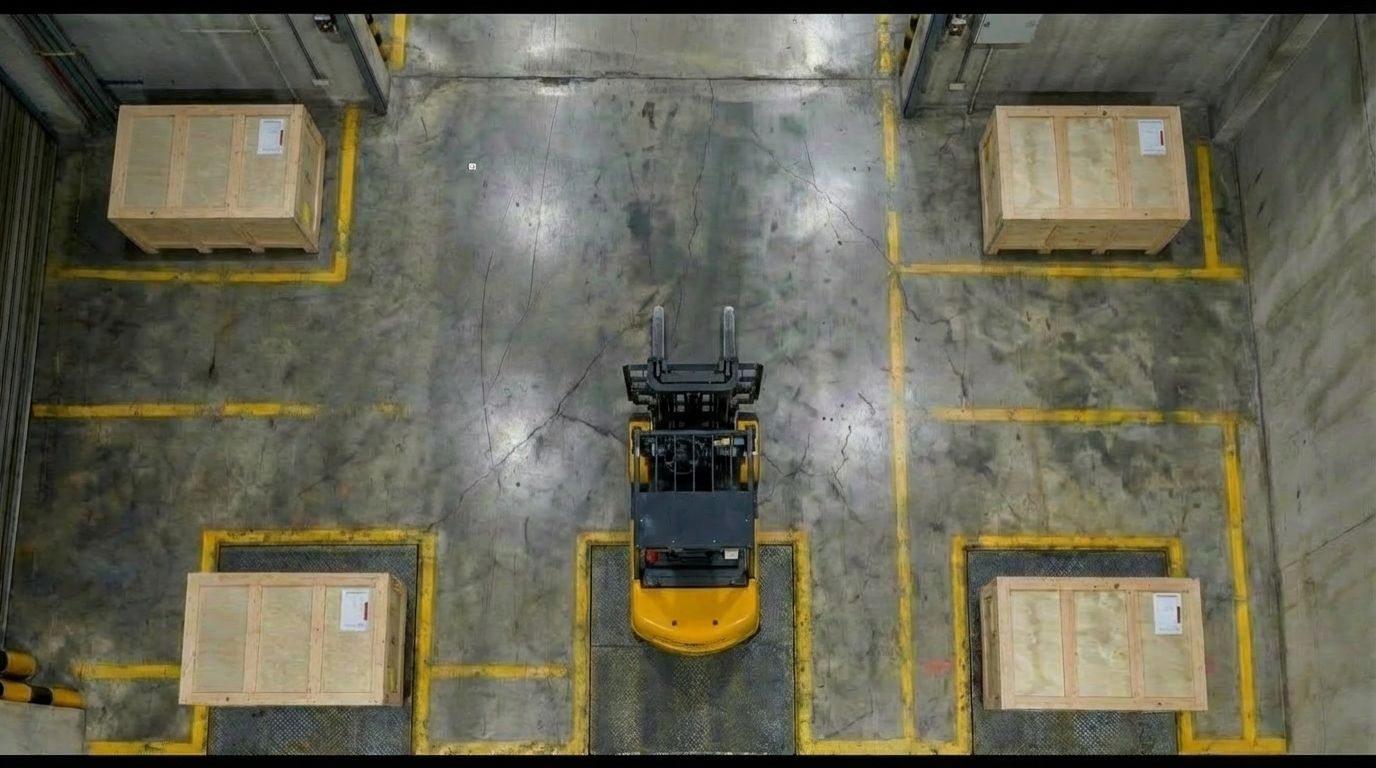
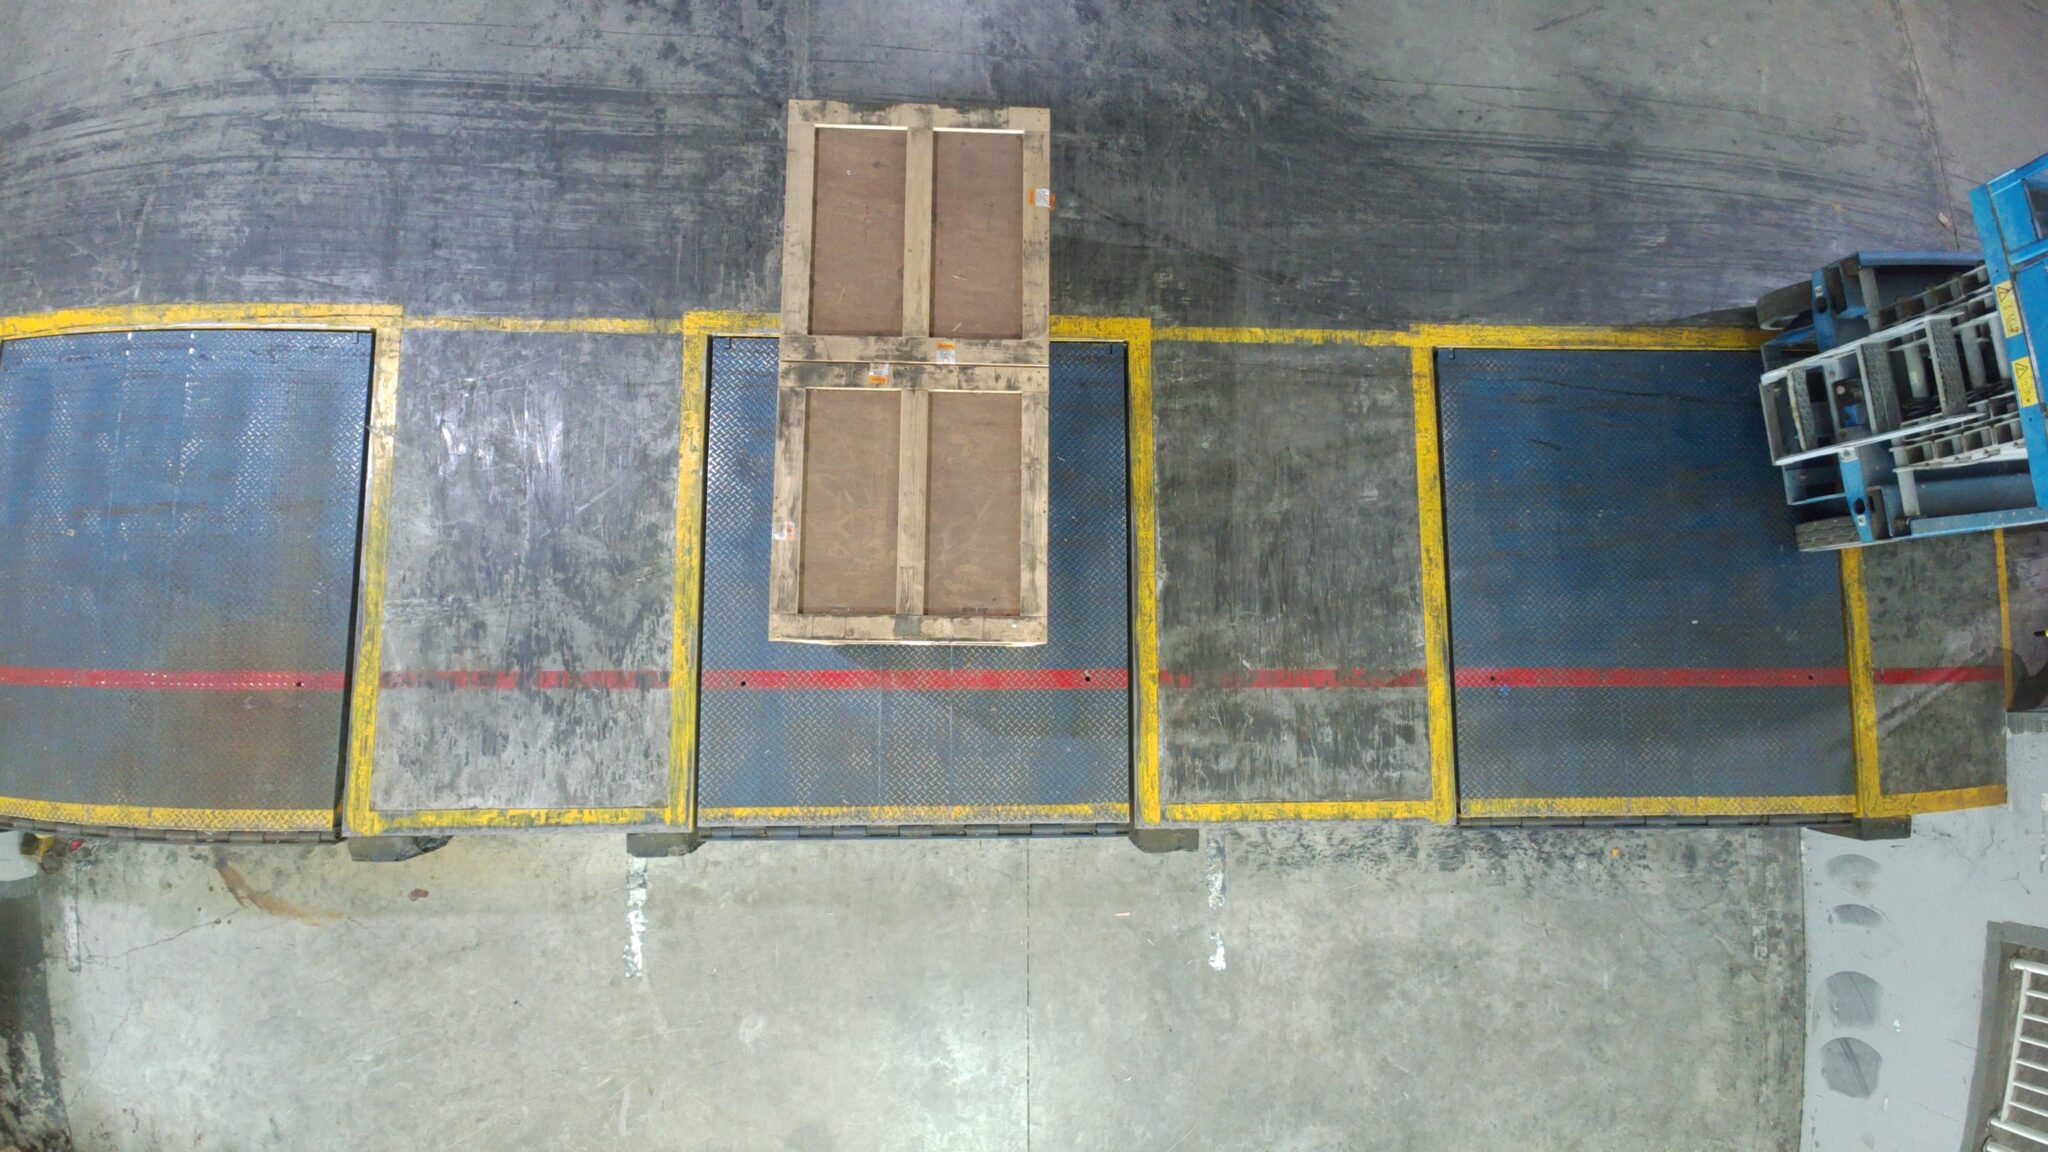
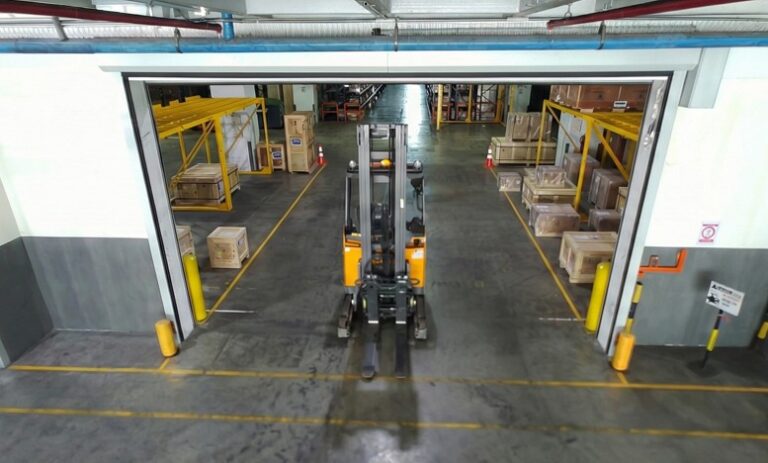
At night or during regular operations, the SafeSight device continuously captures video of the warehouse floor from its mounted position.
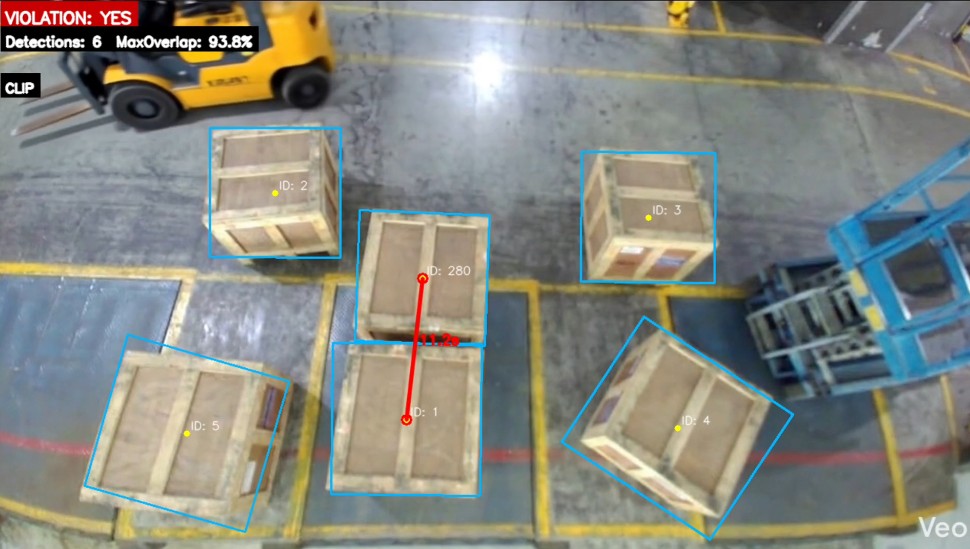
2
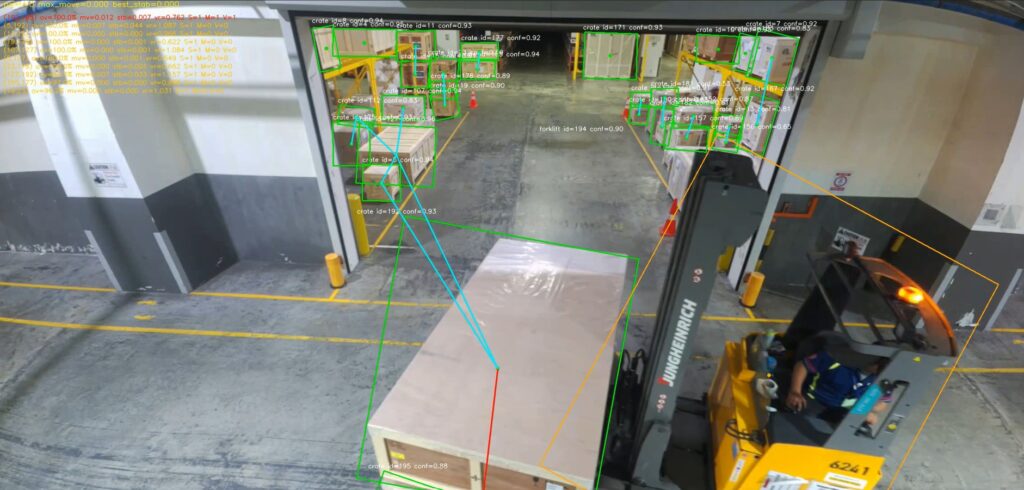
Cameras Detect Violation
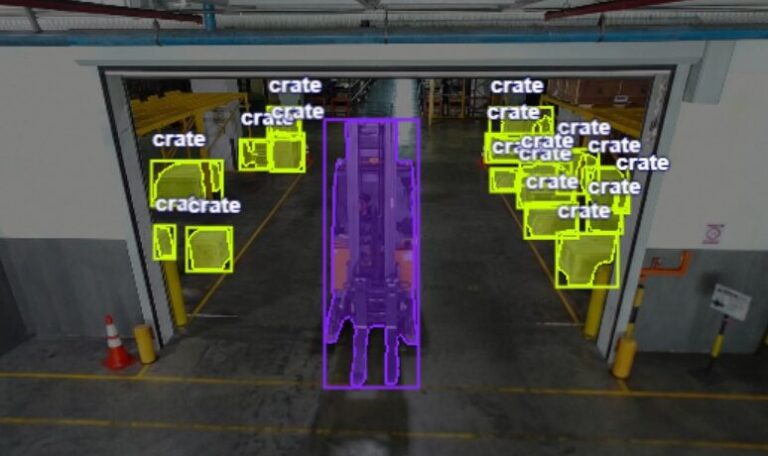
On-device inference identifies SOP violations in real time — such as Back-to-Back Crate Stacking with bounding boxes, confidence scores, and tracking IDs.
3
System records relevant footage
Once a violation has been detected, the system automatically records a clip of the incident with timestamps for later review.
4
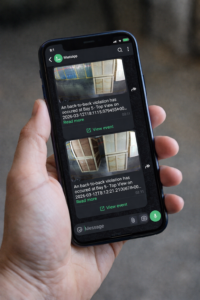
WhatsApp notification sent
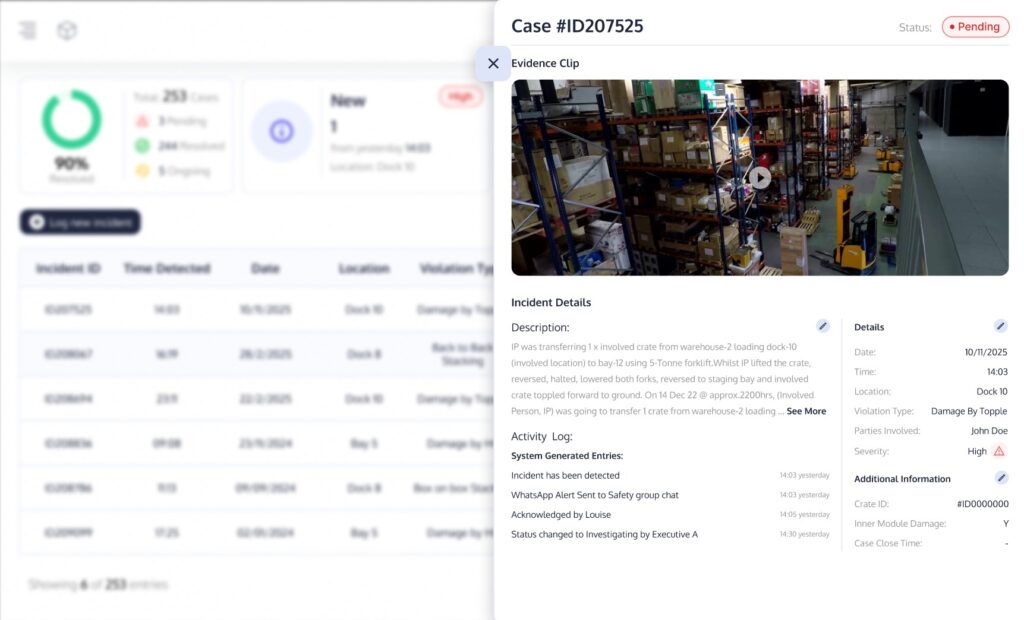
The supervisor receives an immediate WhatsApp message with the violation type, location, time, and a thumbnail of the incident.
Flow B
Review and Reporting
1
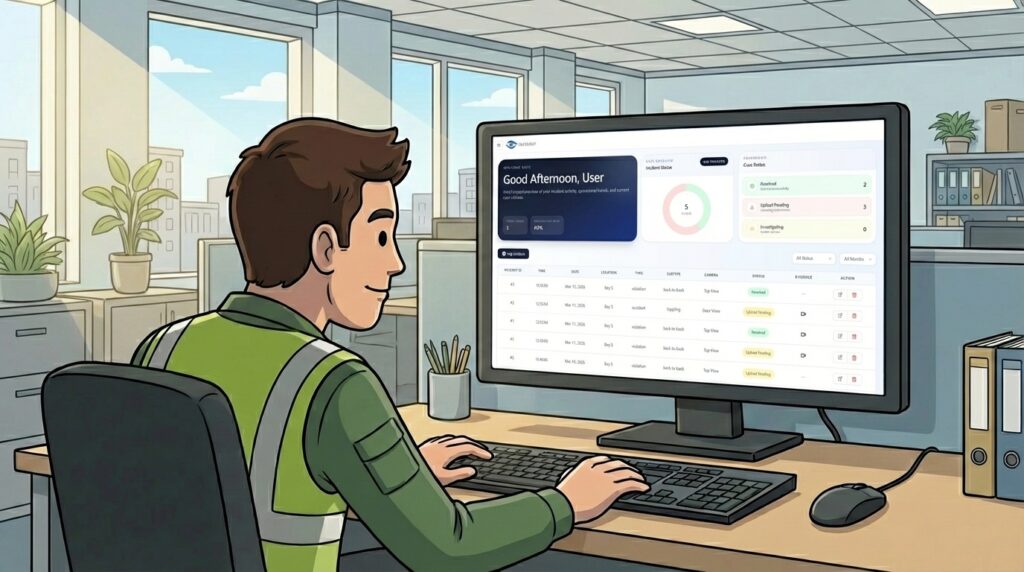
Open User Portal
Warehouse supervisors access the SafeSight User Portal to see a full table of historical violation events, filtered by date, status, and type.
2
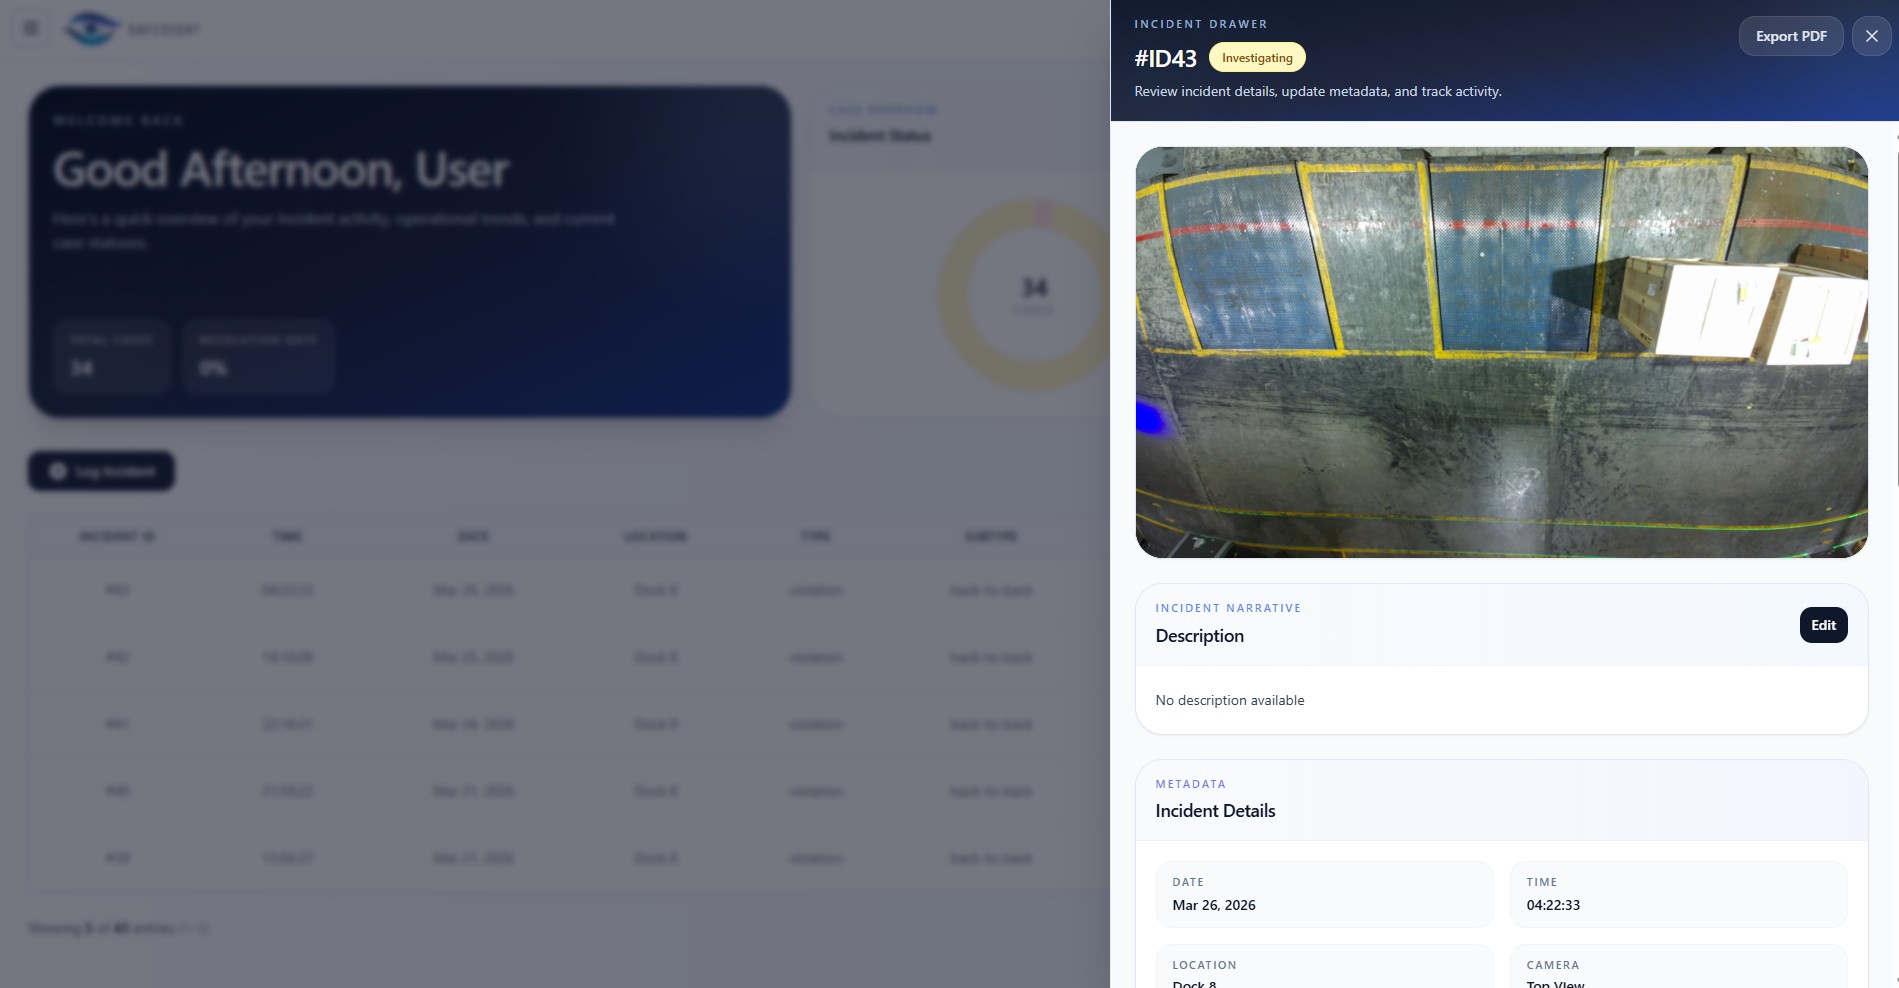
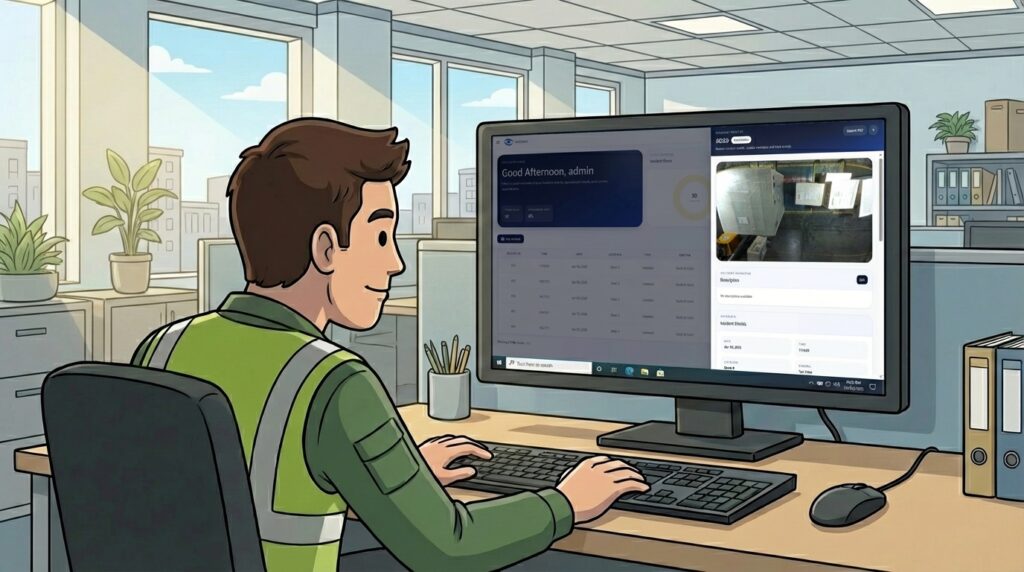
Review events and footage
Each event opens a detail drawer with video preview, incident summary, timestamps, and the ability to manually edit incident information.
3
Generate Reports and Close Cases
Completed reviews can be exported as formal incident reports with important information such as violation type, date and location etc.
Poster
System Impact
Operational Costs Reduced
Drives cost savings by avoiding lost productivity, product replacement and recrating costs with ~1.2 month ROI
*Assumes 20% accident reduction via WhatsApp, accounting for delays
Response Time Reduced
Reduces response time from hours to minutes via automated trace-back
*~5 minutes trace-back based on user testing
Carbon Emissions Reduced
Reduces emissions by minimising re-crating from fewer incidents
*Assumes average 1.89 metres cube crate size and 15 accidents/year
User Testimonials
On the ground, this solution makes a real difference. Instead of relying on manual checks, supervisors can now act on real-time alerts and focus on preventing incidents before they escalate.
Louise Leong
Snr. Operations Manager
It acts as a monitoring tool that alerts operators and provides snapshots only when violations occur and has been very helpful in tuning operator behaviour. We are already engaging a vendor for full warehouse deployment.
Khoo Jia Ren
Snr. Executive
Acknowledgements
This project would not have been possible without the guidance and support of several individuals. We are incredibly grateful to our industry mentor, Louise, for her time and expertise as well as Professor Thomas for his mentorship and feedback. A special thanks goes to Jia Ren, one of the warehouse supervisors, for his practical help on the ground.
At Singapore University of Technology and Design (SUTD), we believe that the power of design roots from the understanding of human experiences and needs, to create for innovation that enhances and transforms the way we live. This is why we develop a multi-disciplinary curriculum delivered v ia a hands-on, collaborative learning pedagogy and environment that concludes in a Capstone project.
The Capstone project is a collaboration between companies and senior-year students. Students of different majors come together to work in teams and contribute their technology and design expertise to solve real-world challenges faced by companies. The Capstone project will culminate with a design showcase, unveiling the innovative solutions from the graduating cohort.
The Capstone Design Showcase is held annually to celebrate the success of our graduating students and their enthralling multi-disciplinary projects they have developed.