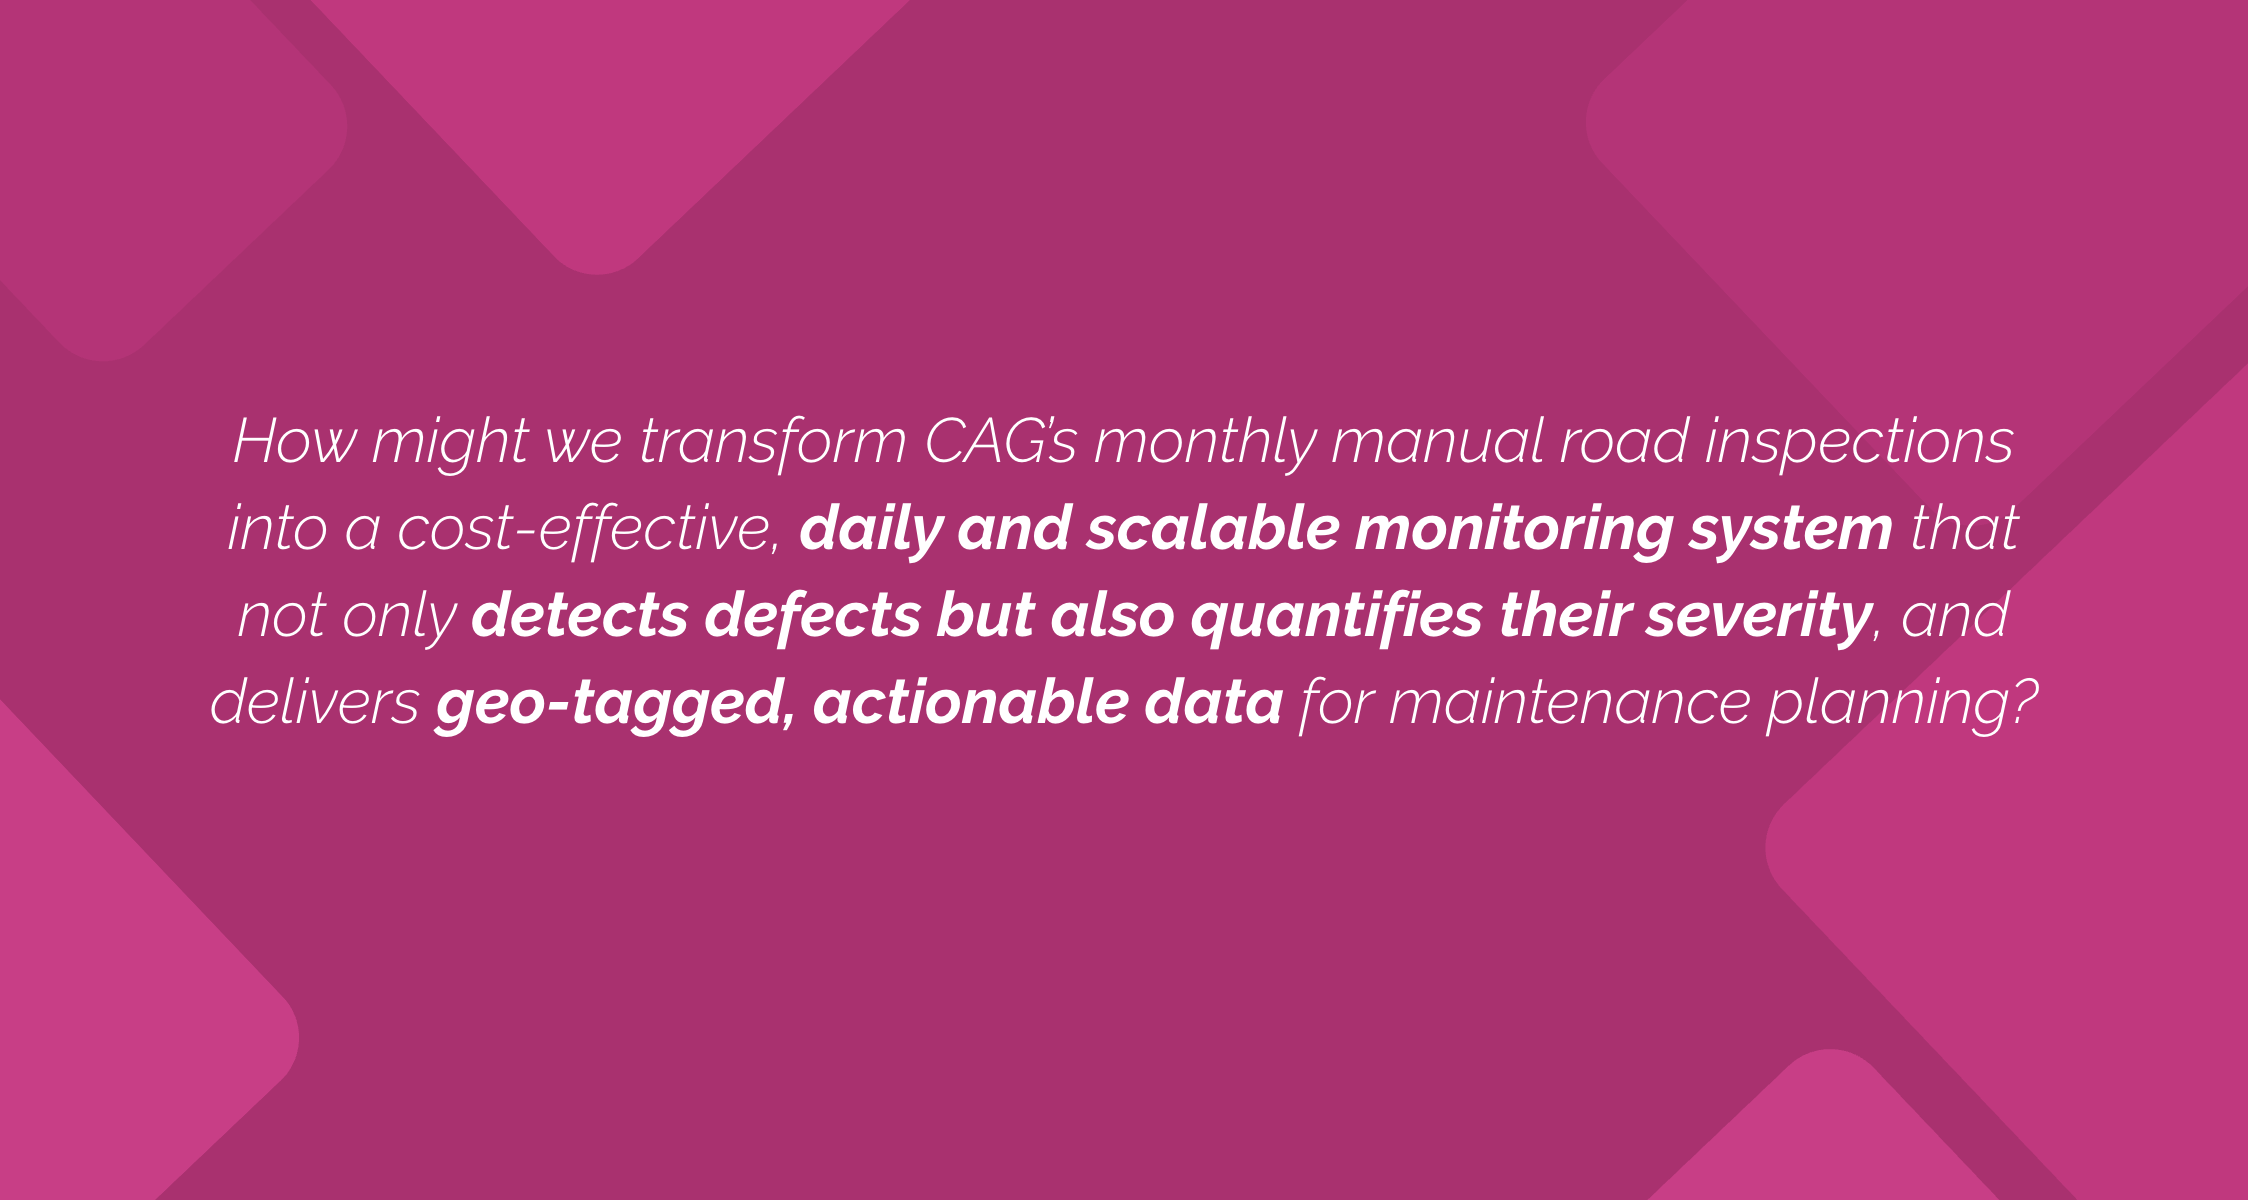
Inspection Frequency
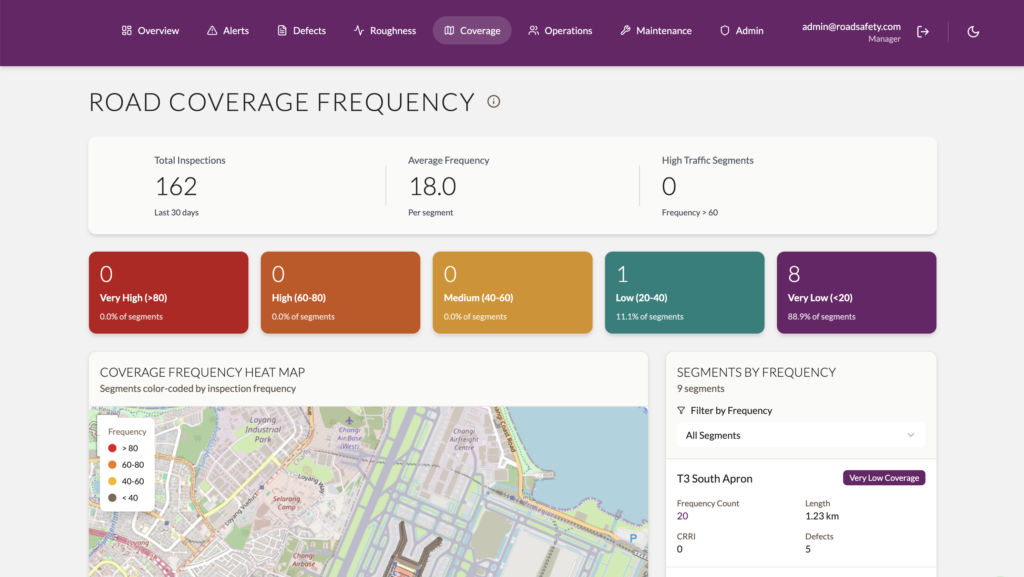
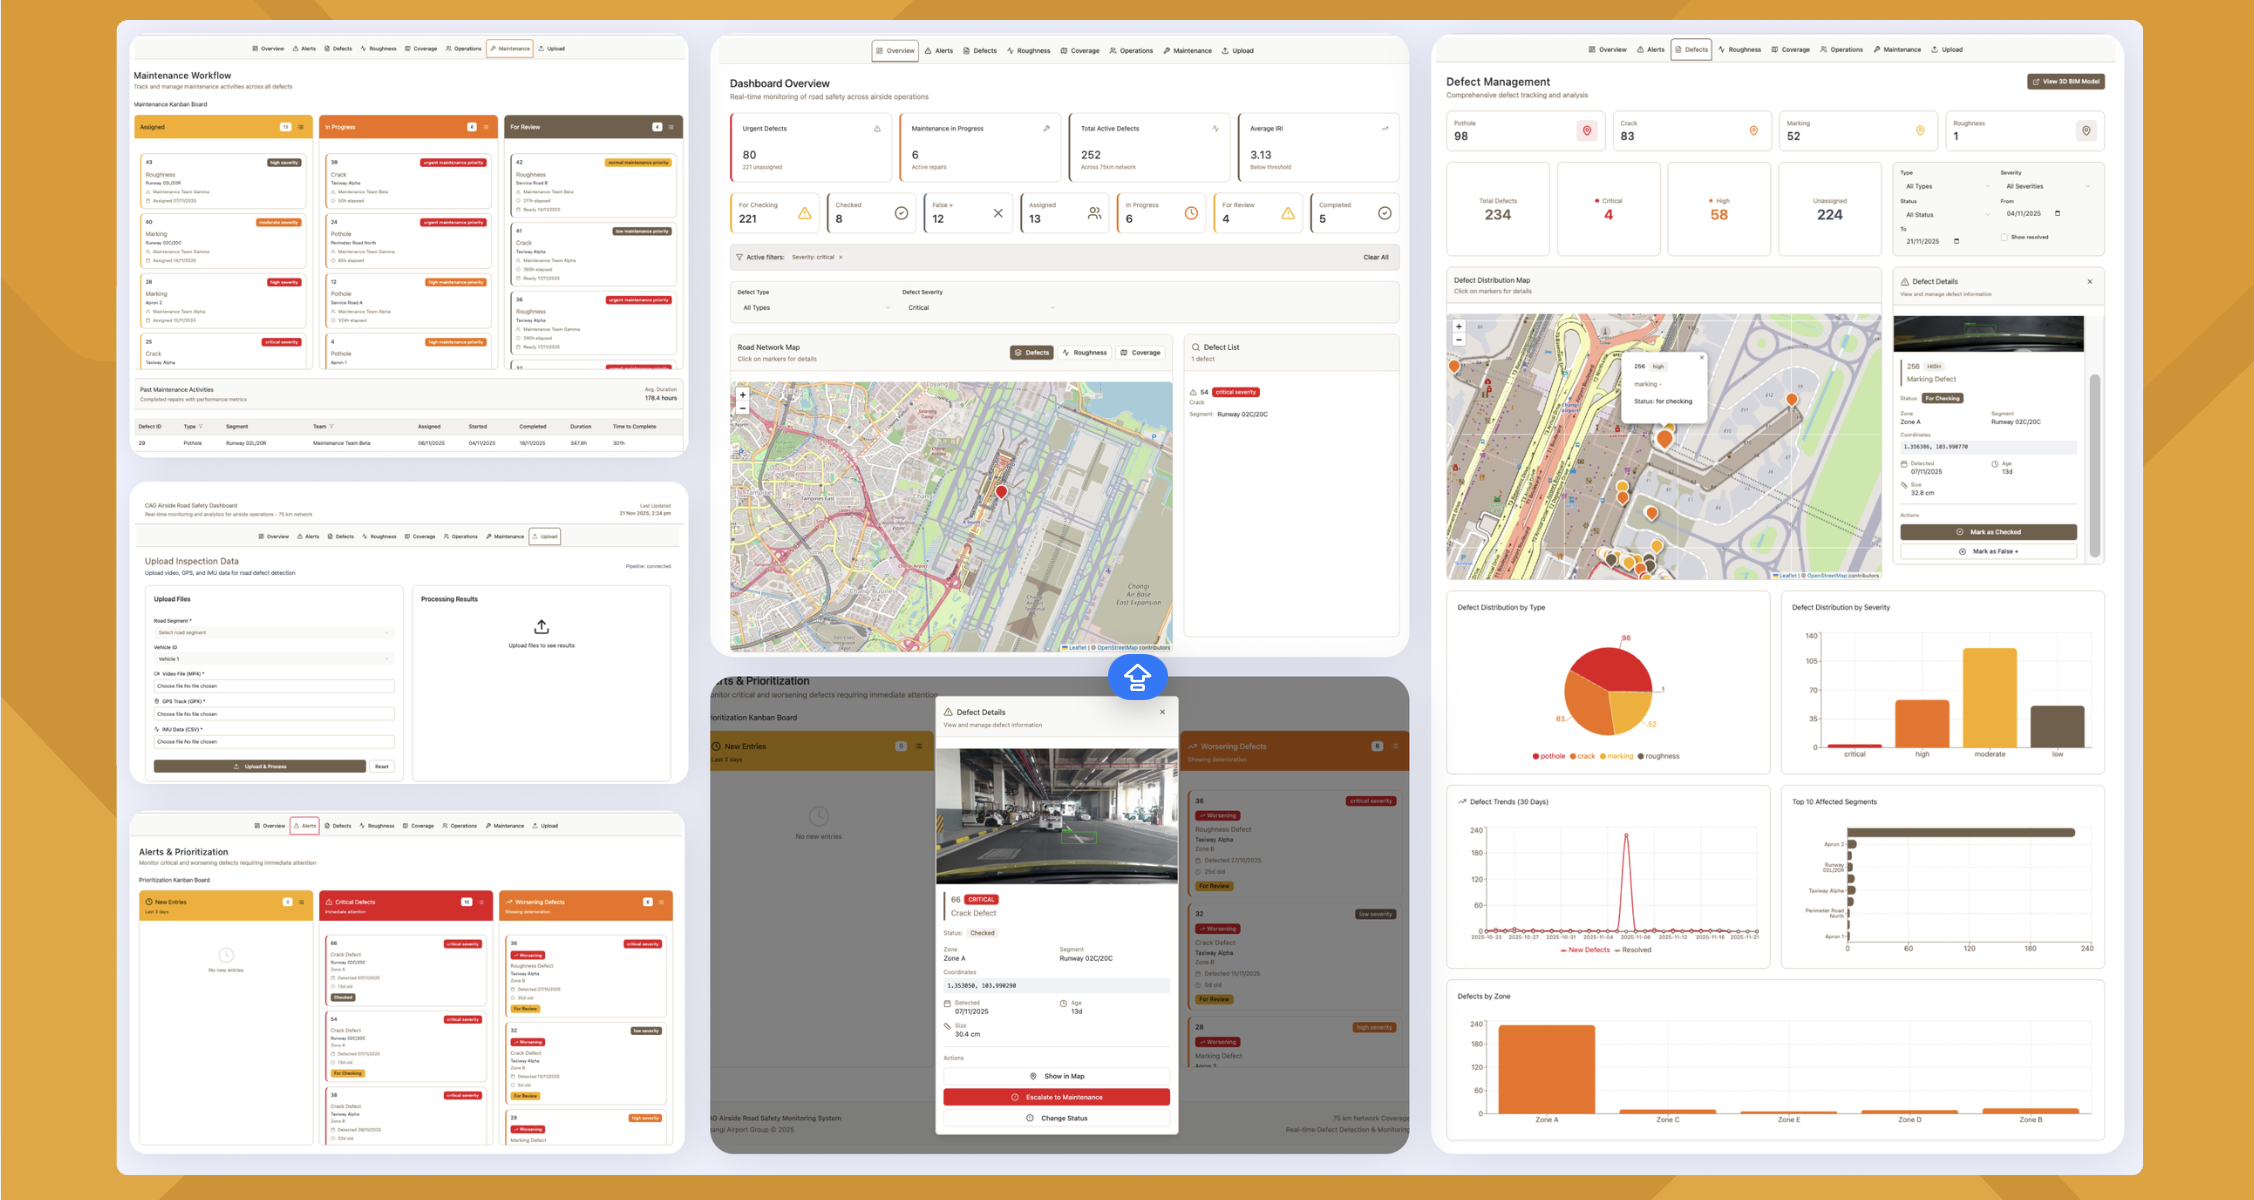
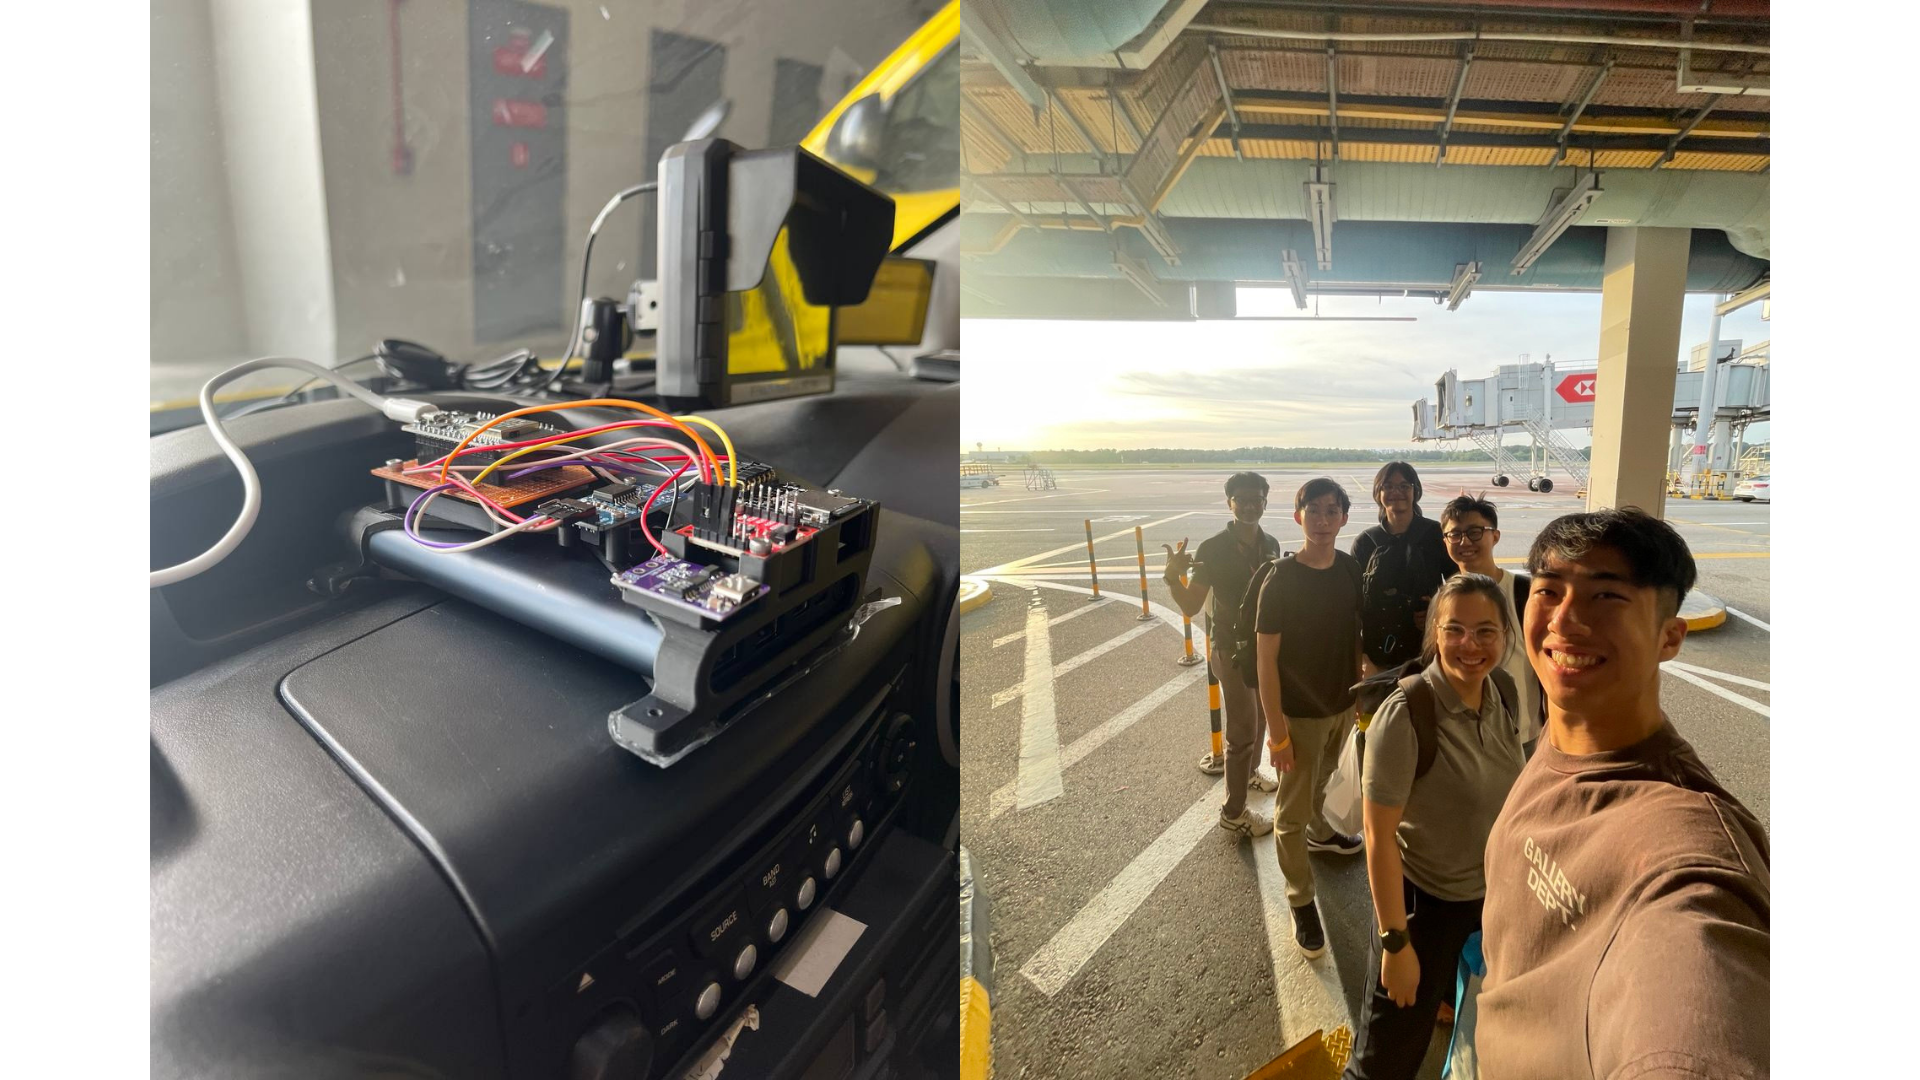
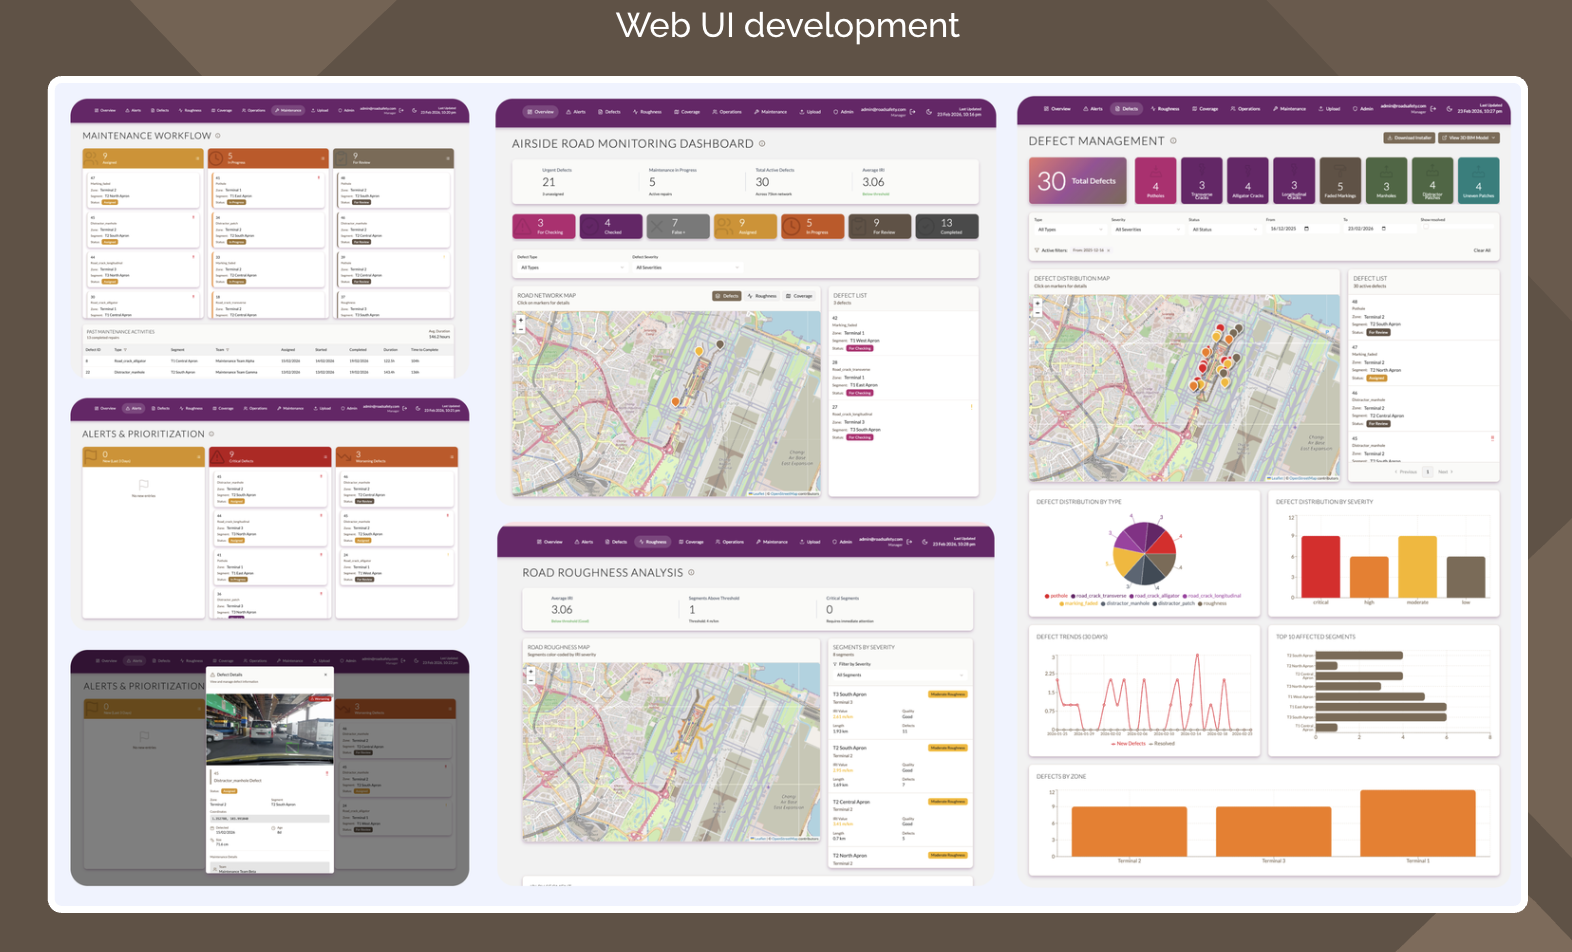
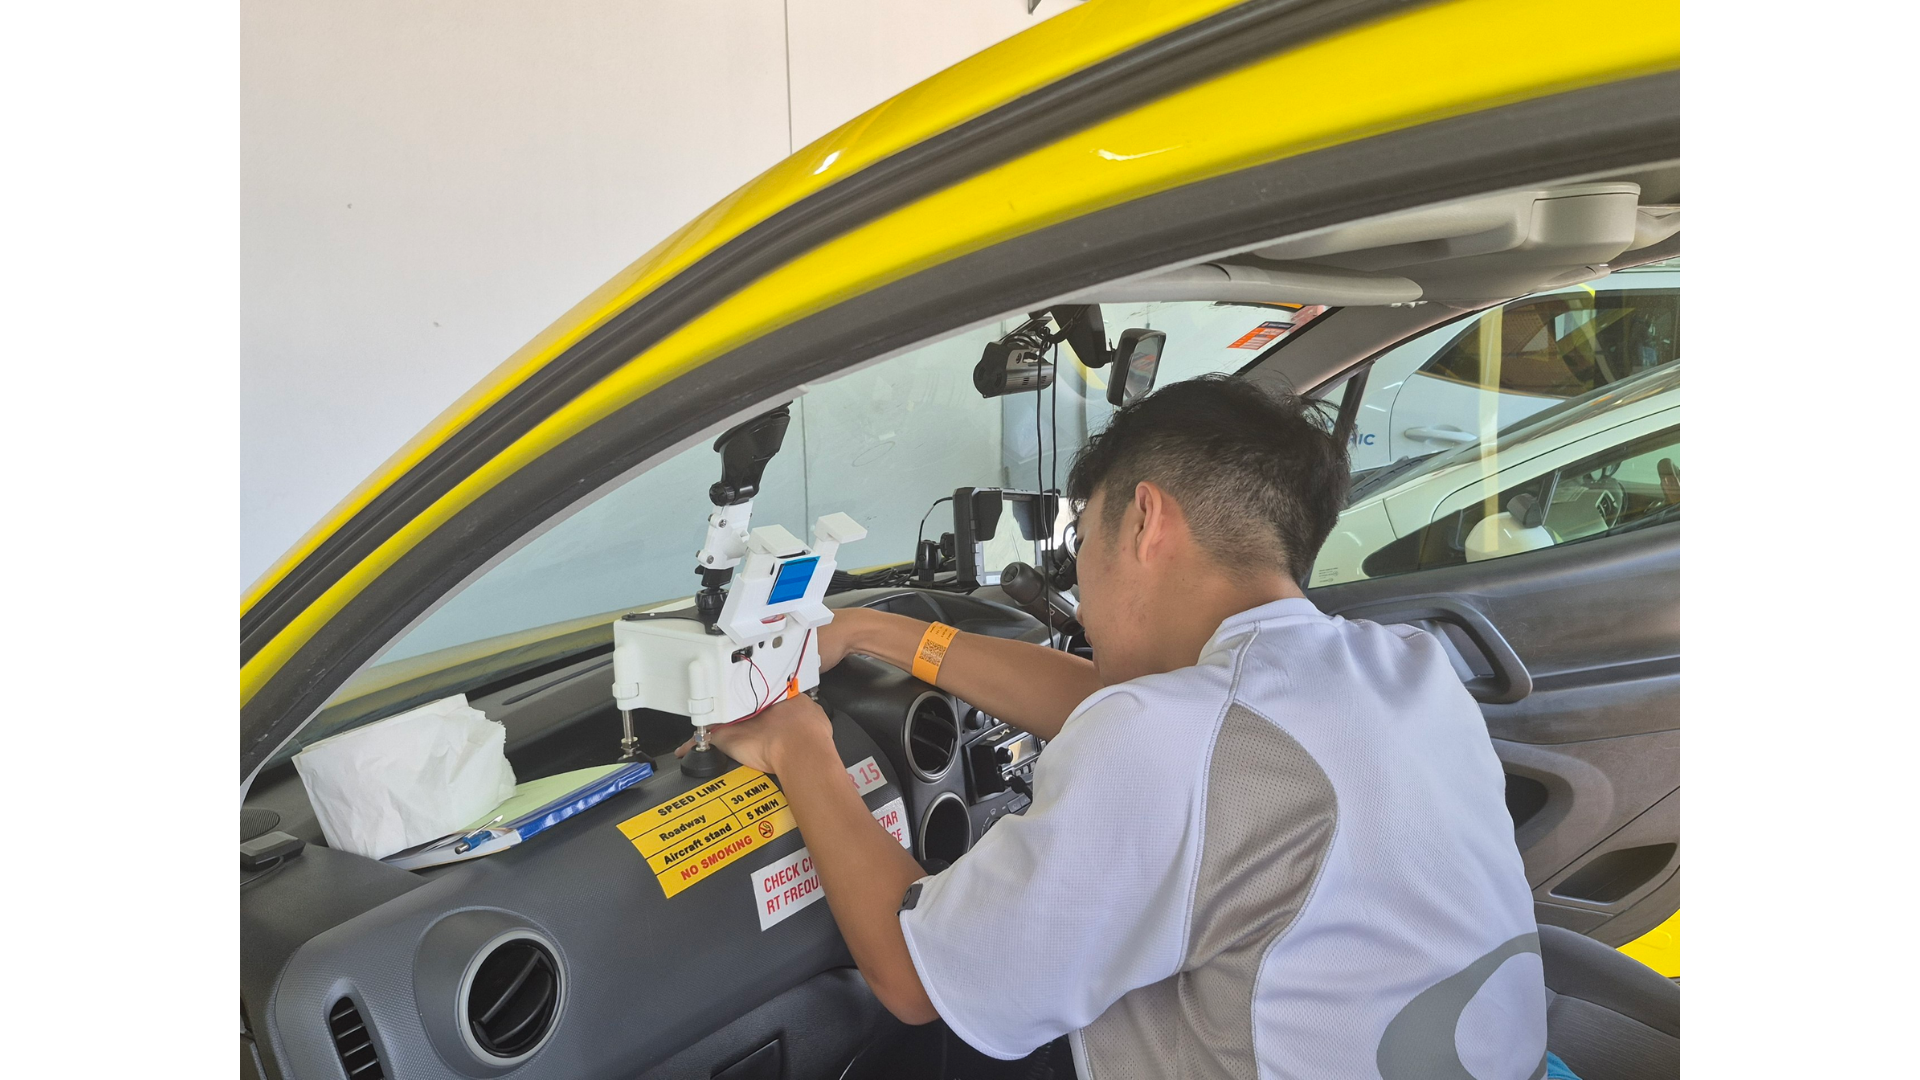
Current workflows rely on infrequent inspections, allowing defects to worsen unnoticed. CAG requires near-daily data collection for timely detection.
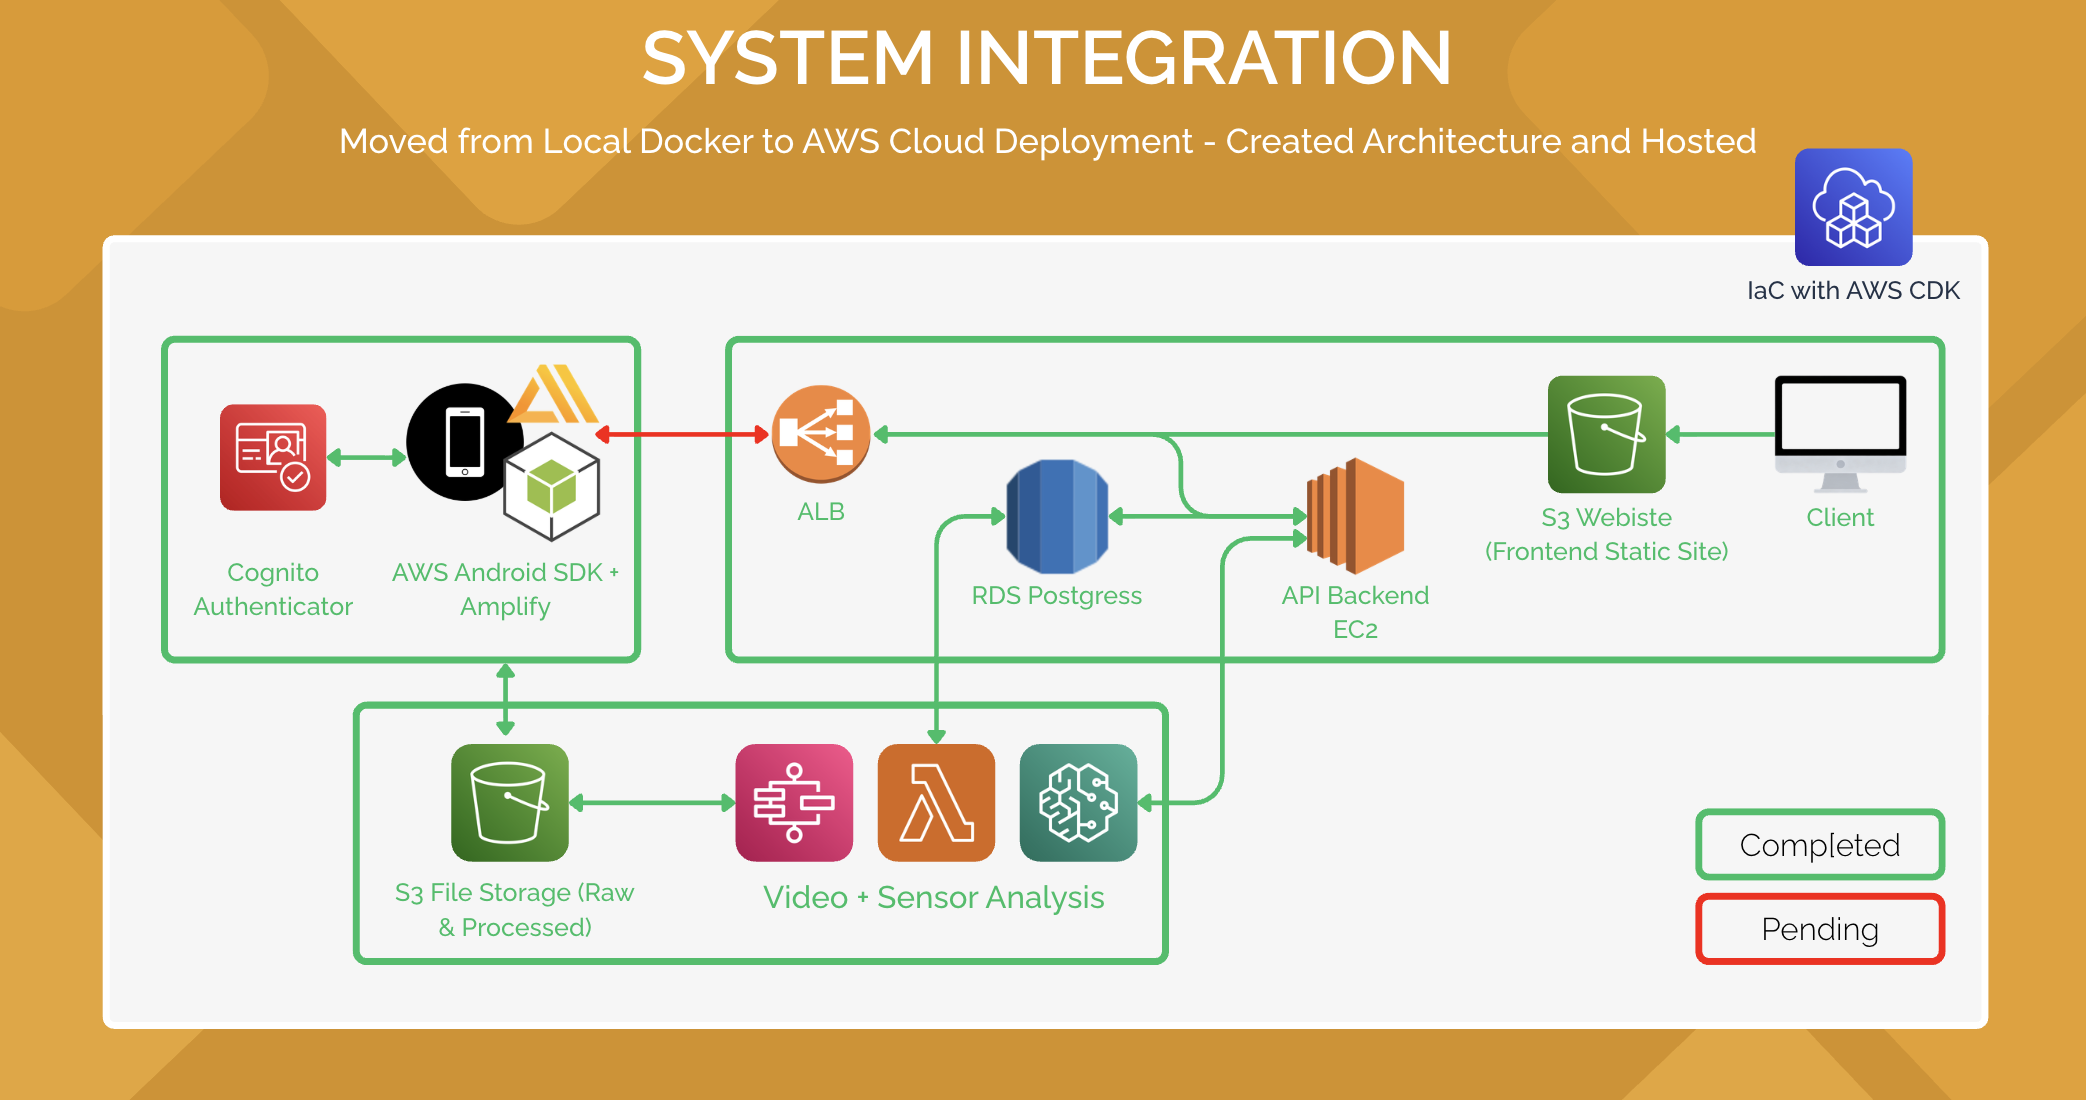
Integration & Scalability
Current solutions operate in silos with limited integration. A scalable, end-to-end system is needed to support fleet-wide monitoring and coordinated maintenance.
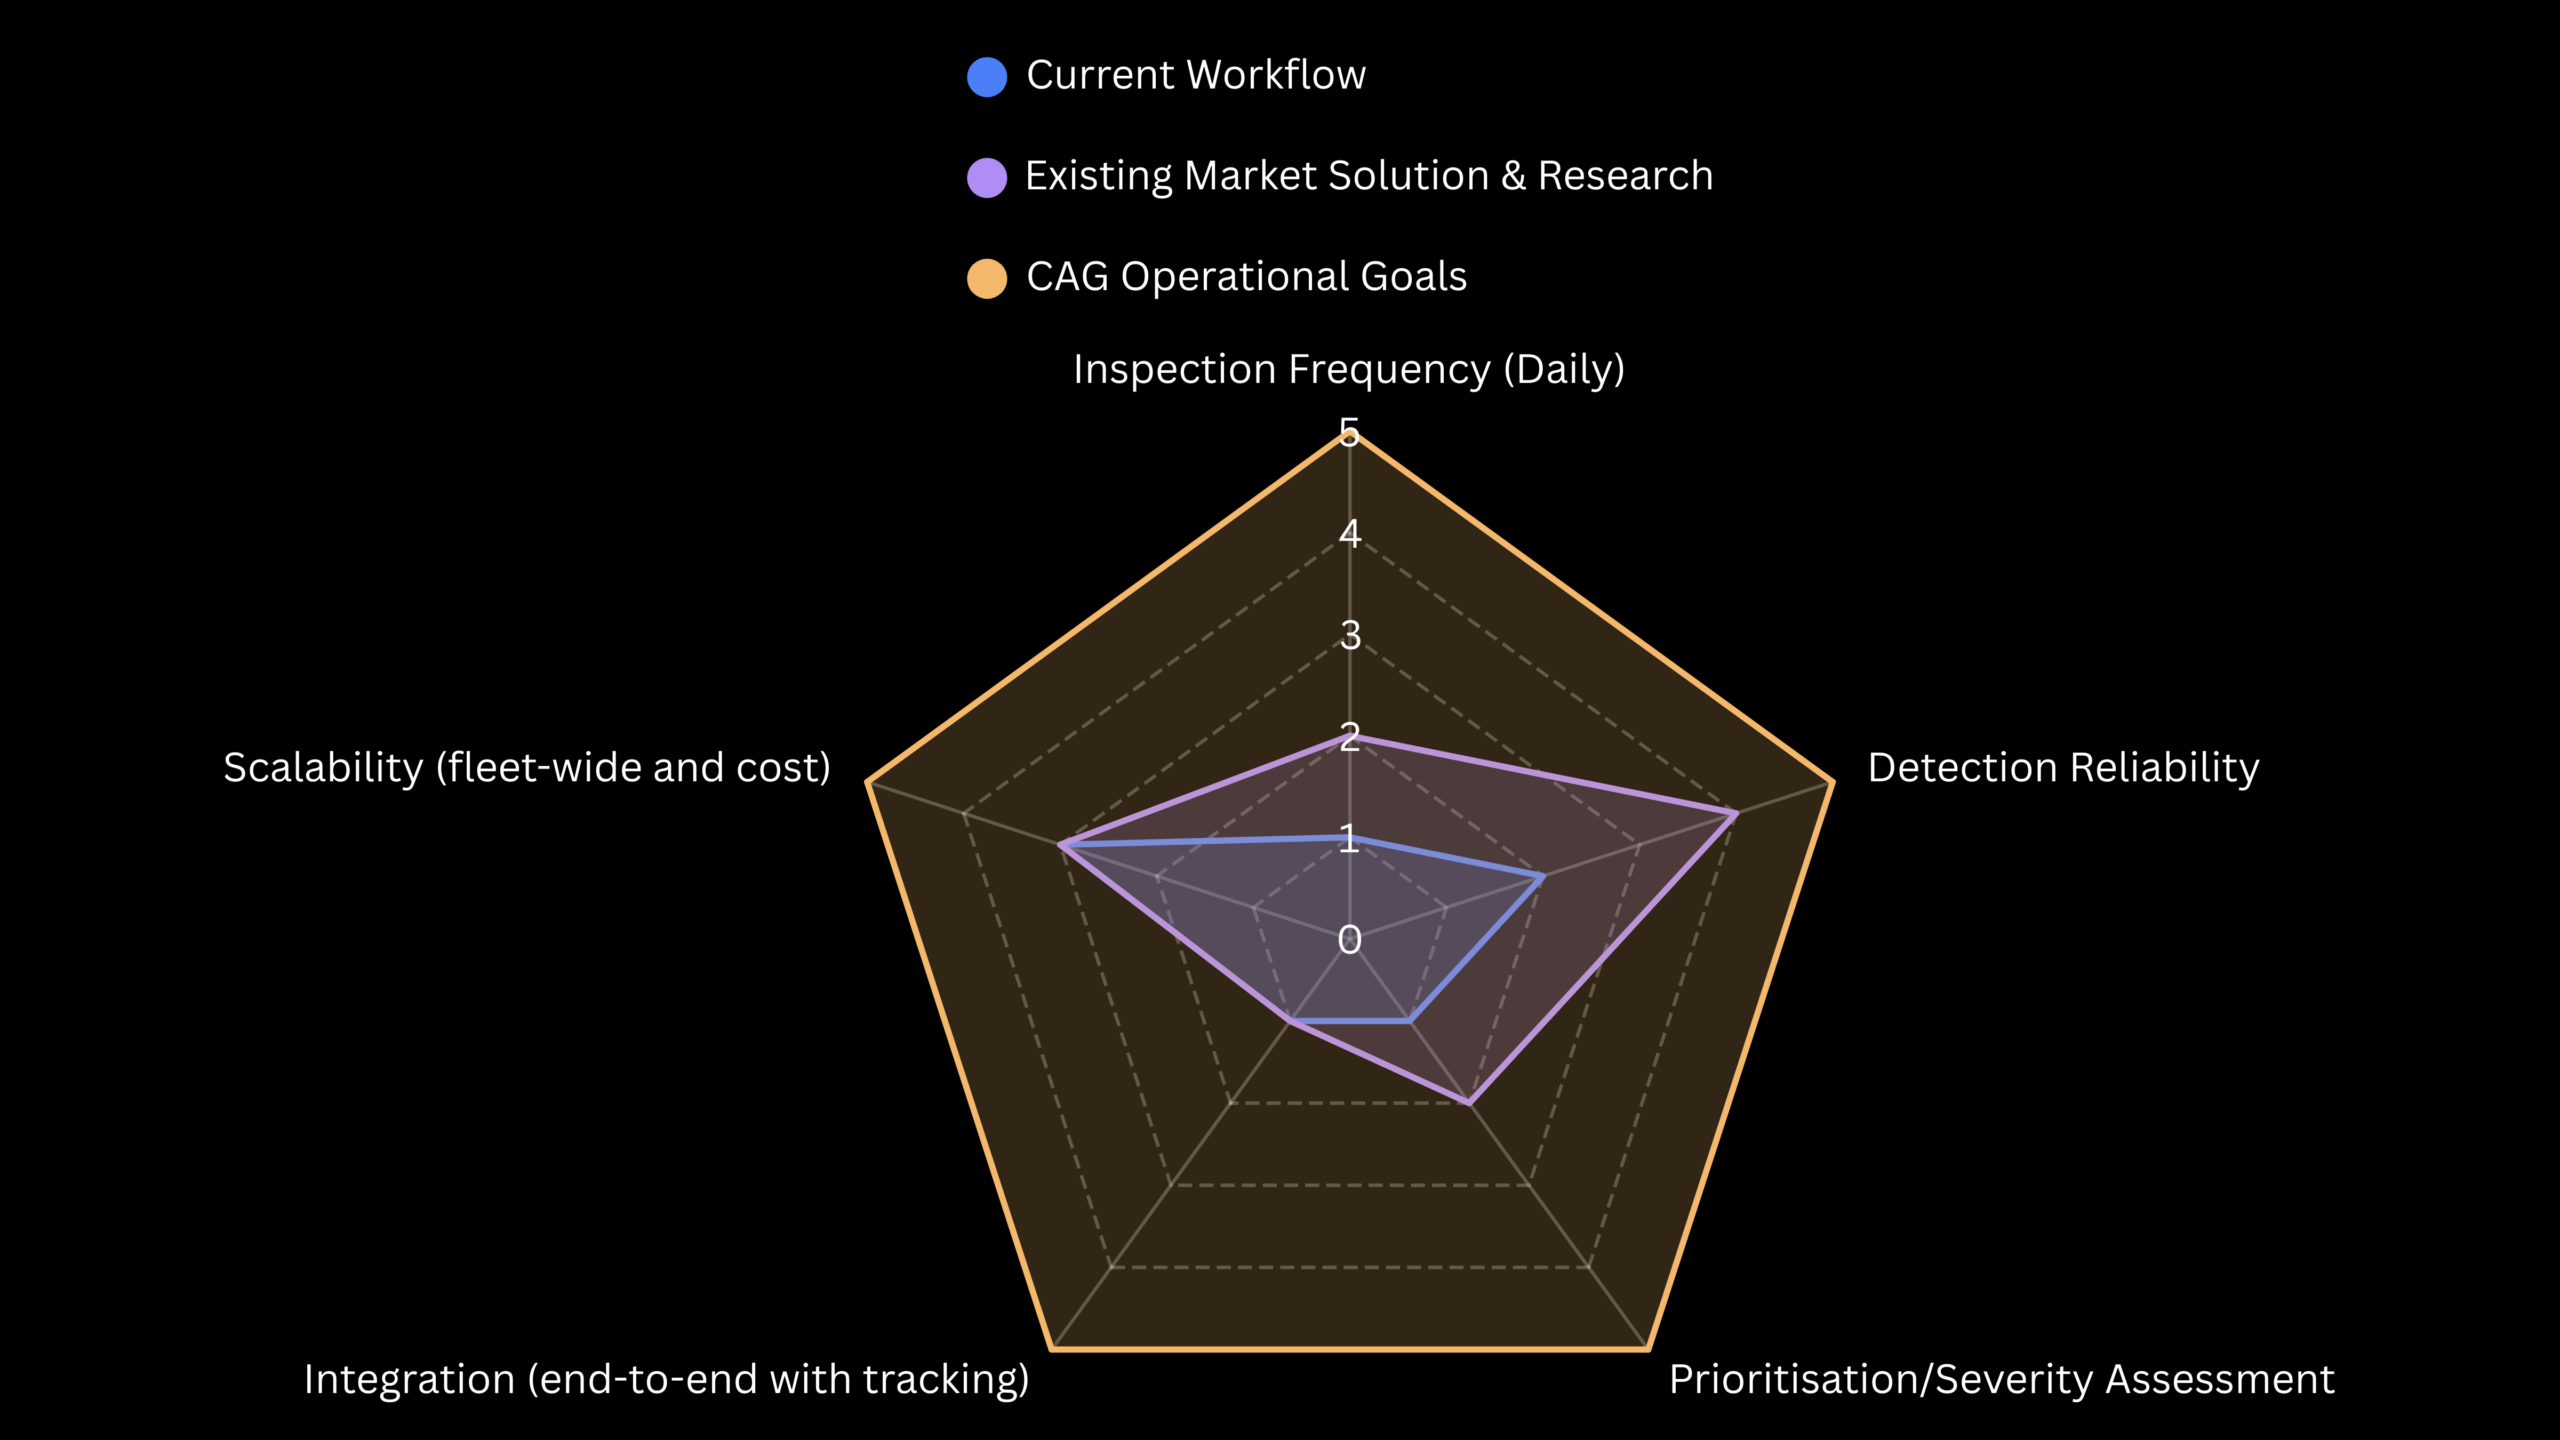
Detection Reliability
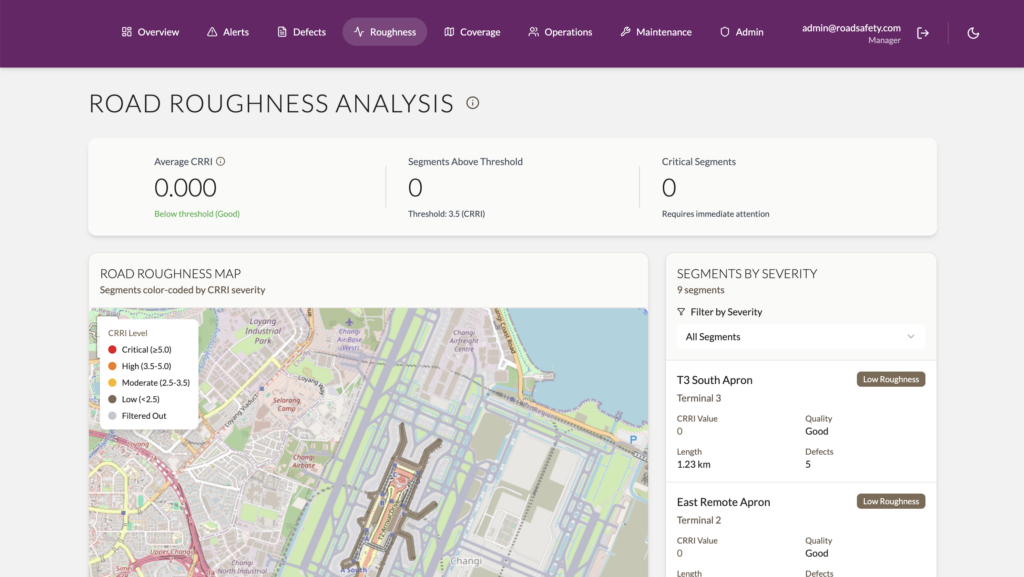
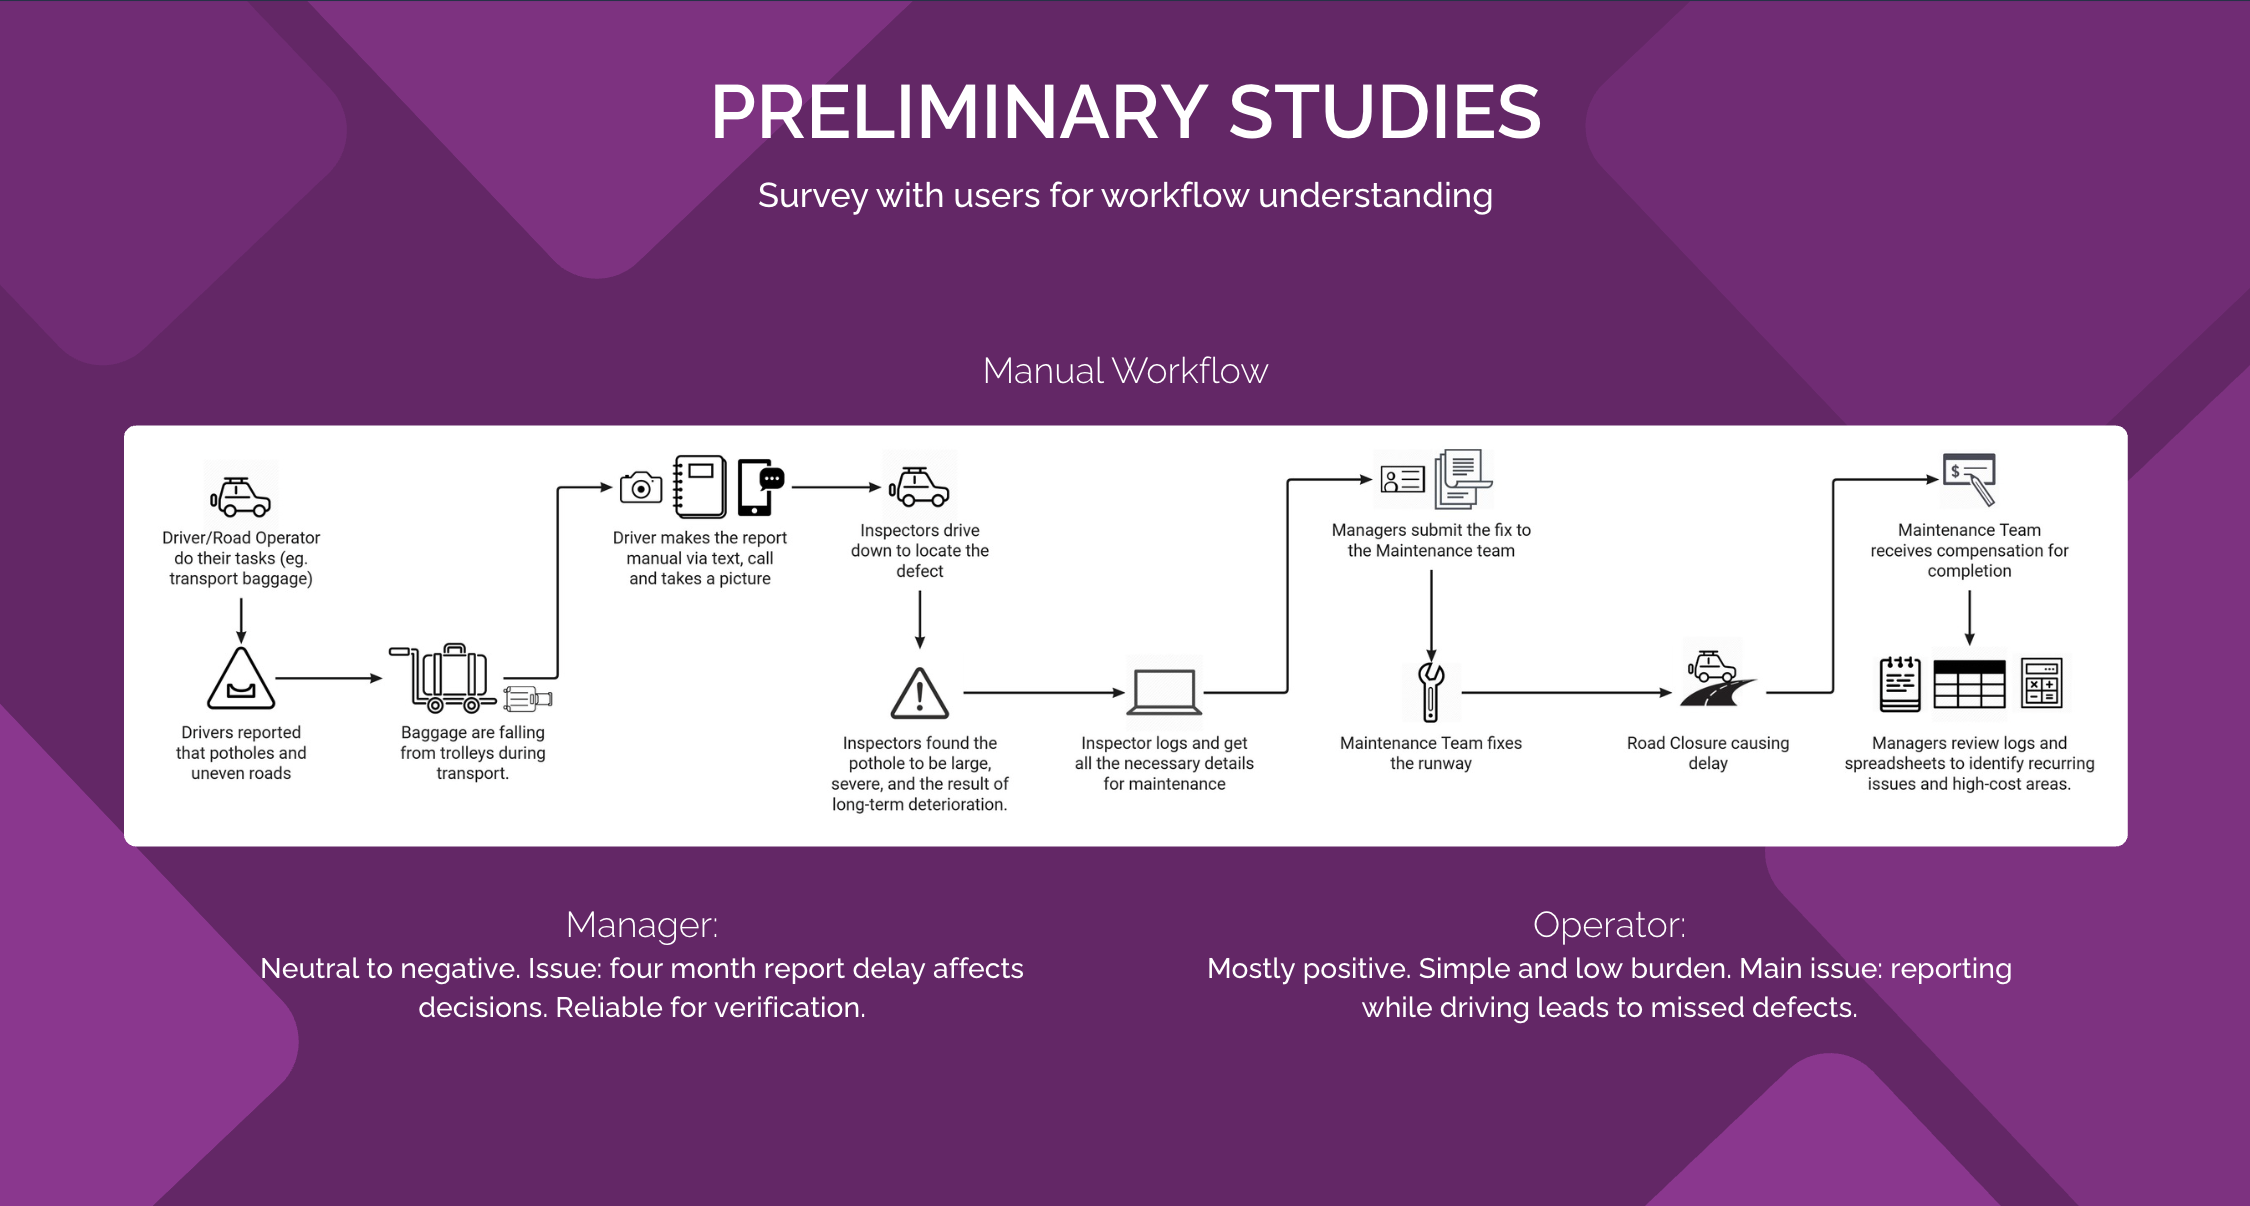
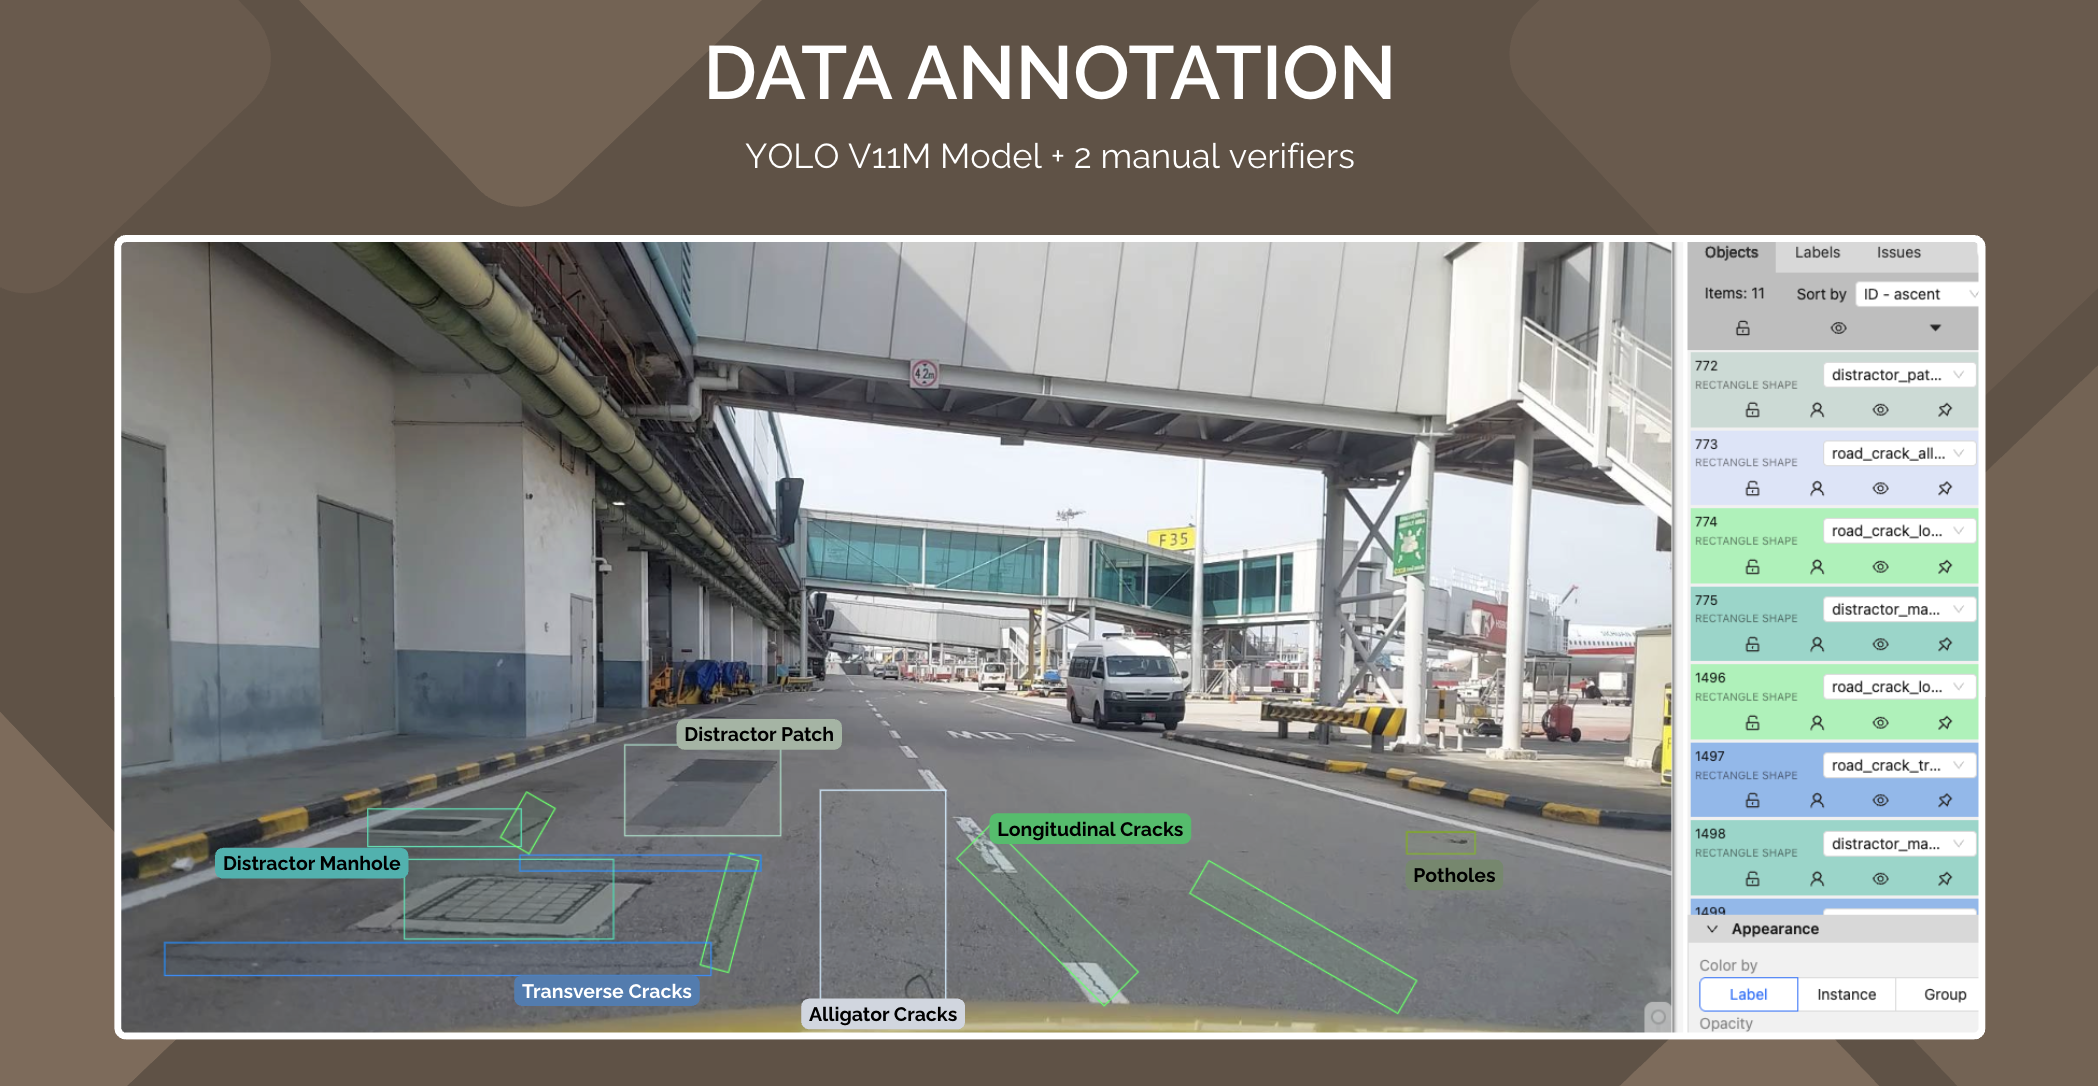
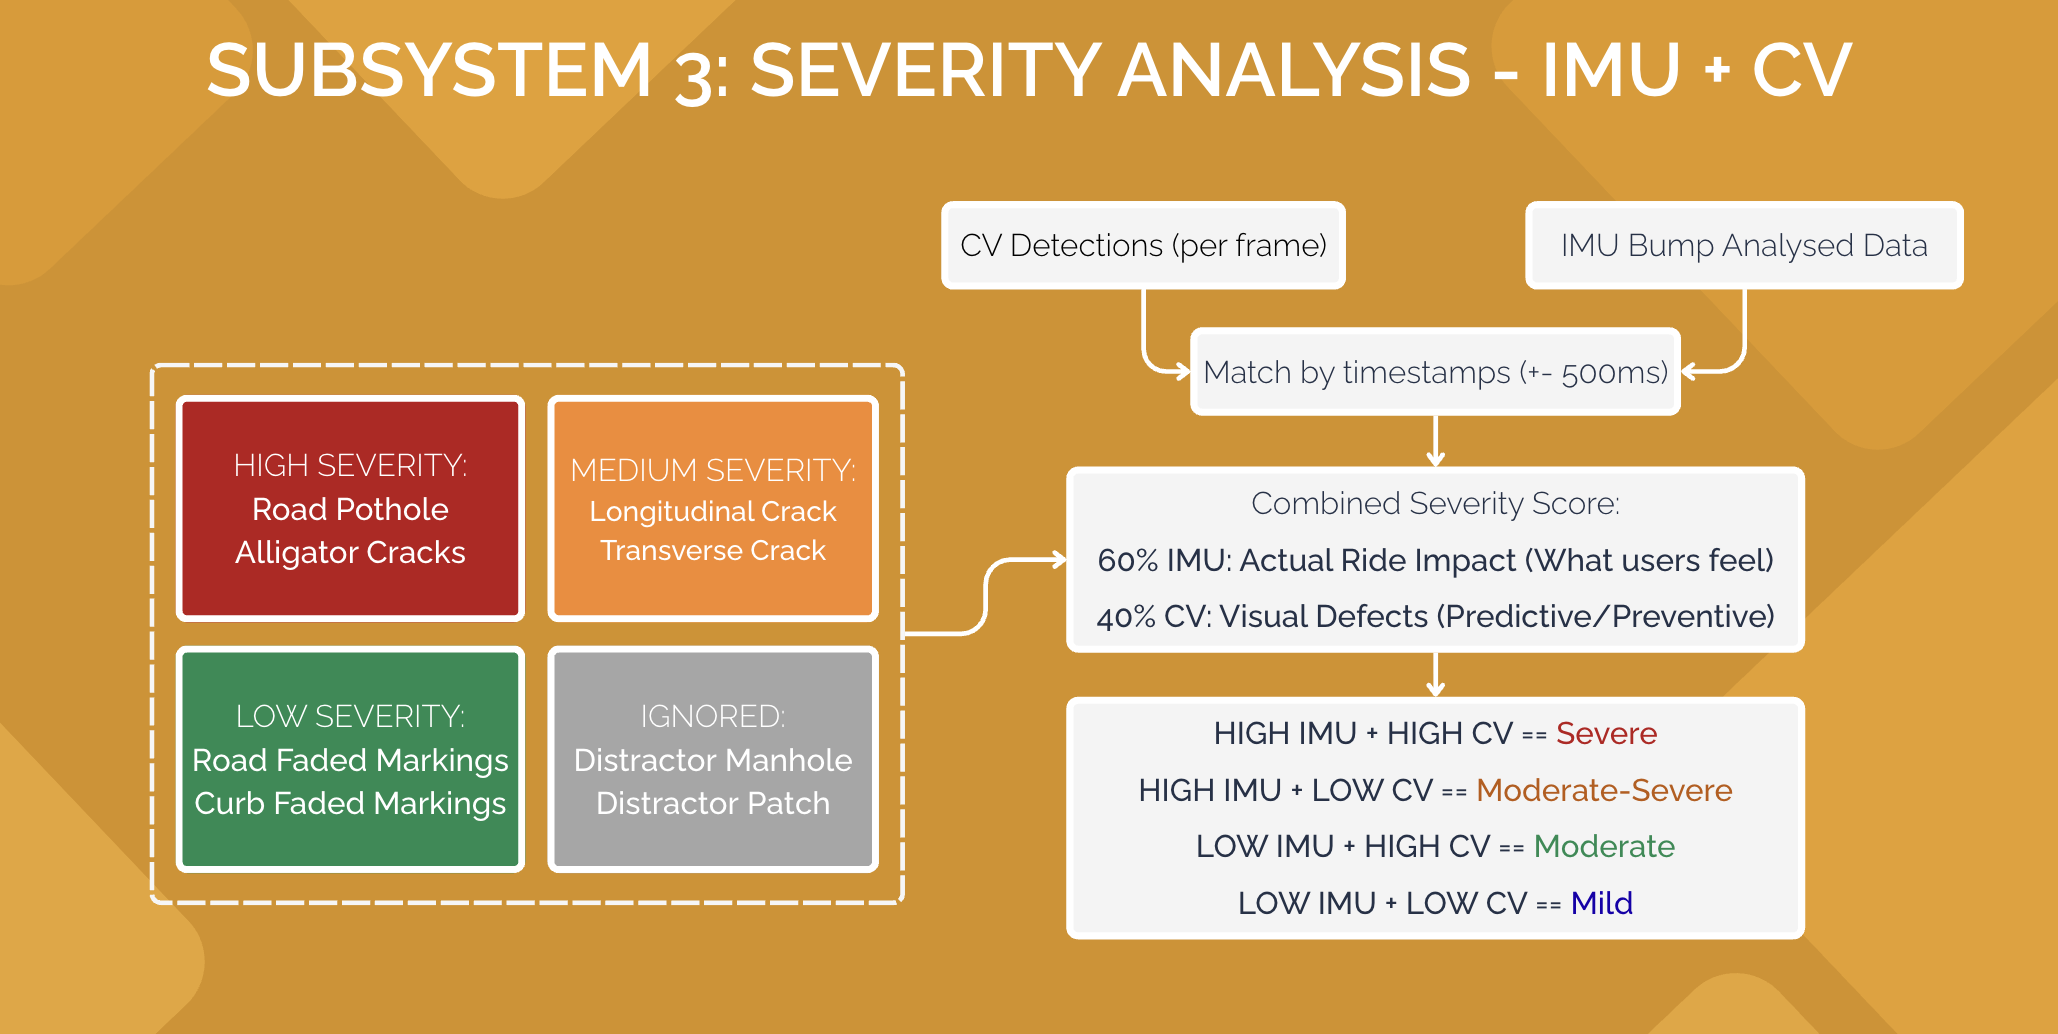
Manual inspections are inconsistent and prone to human error. More reliable, data-driven detection is needed to ensure accuracy across the network.
Maintenance Prioritization
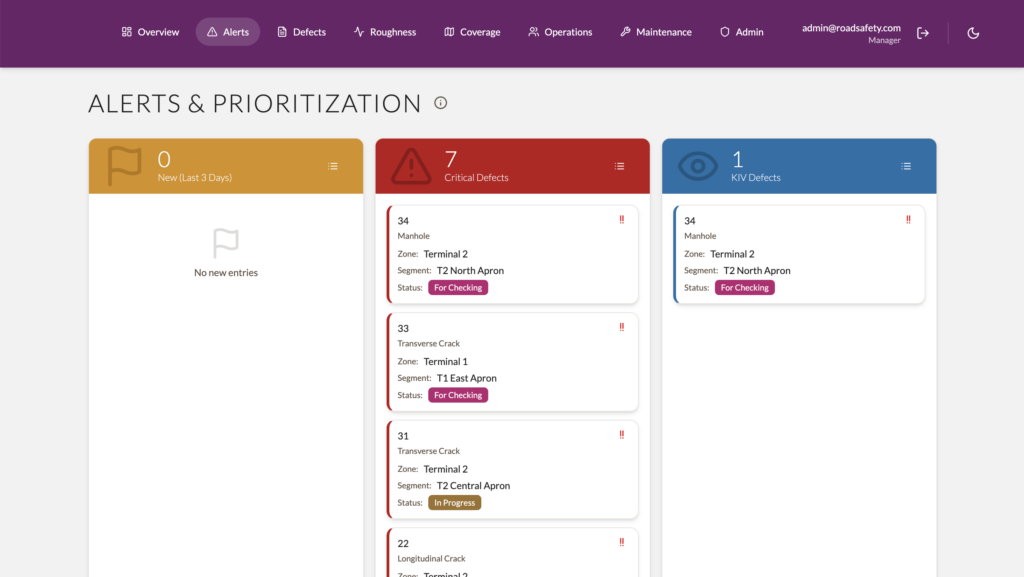
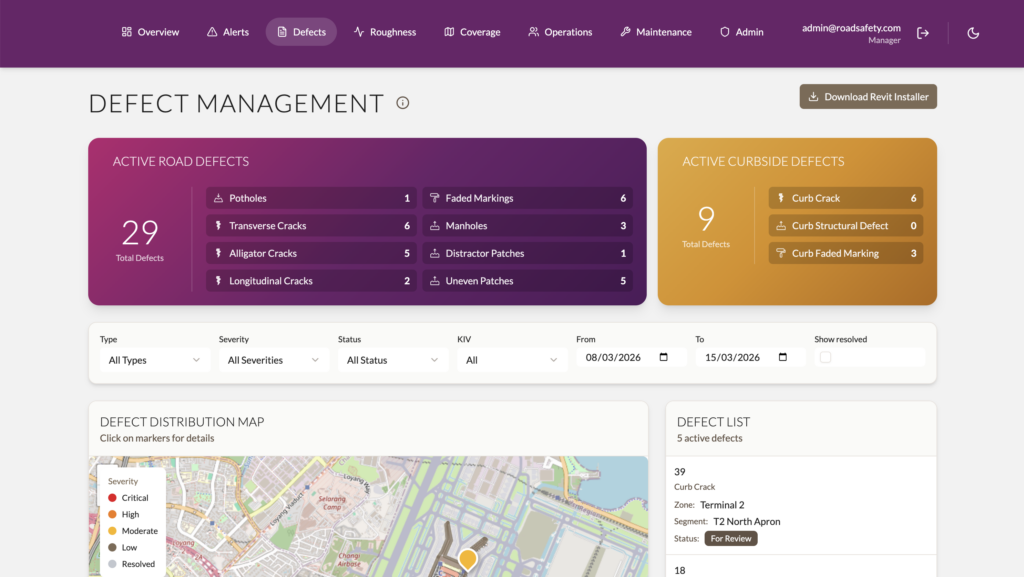
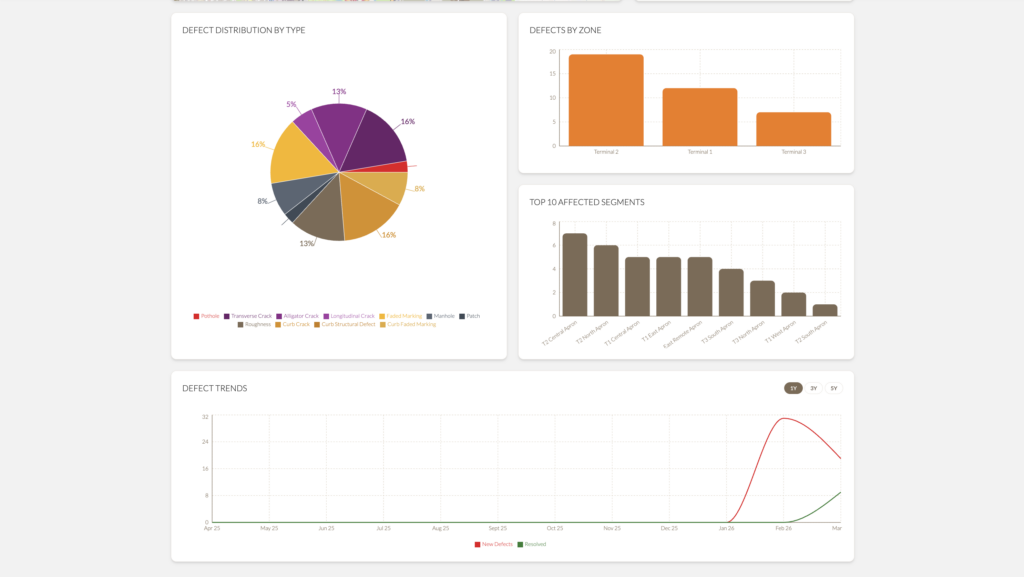
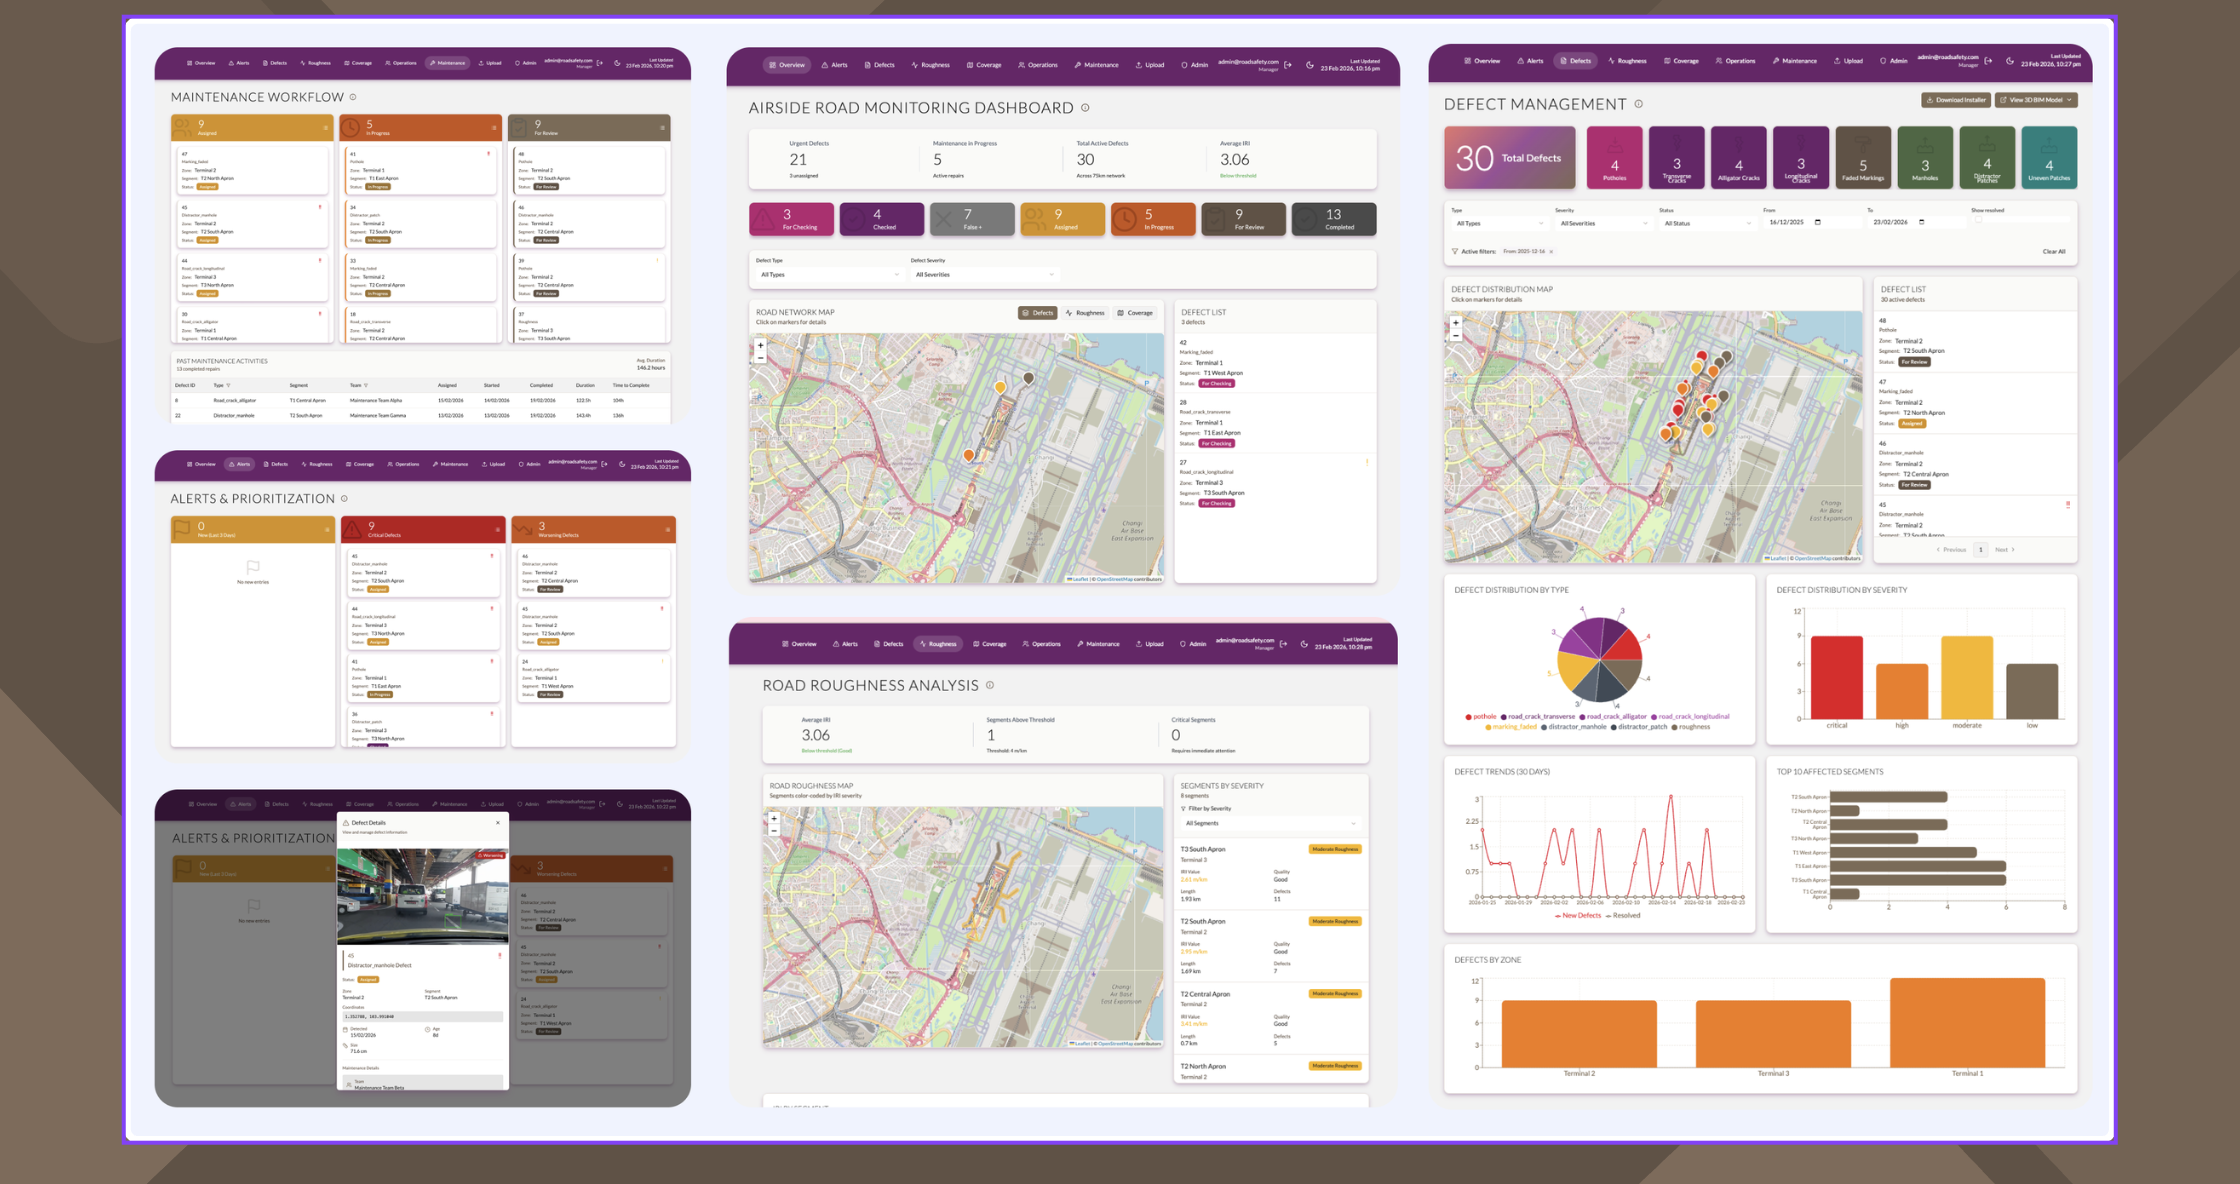
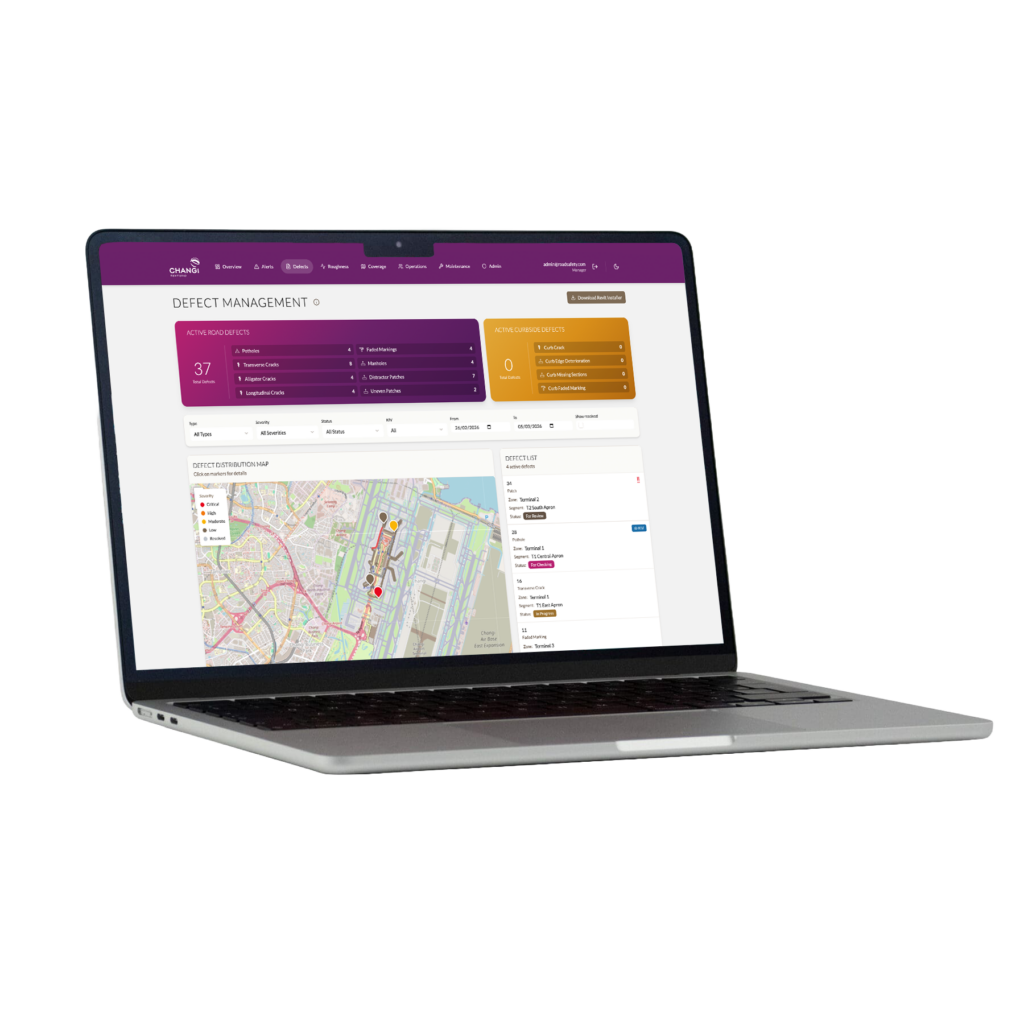
Existing approaches lack clear severity assessment, making it difficult to prioritise repairs. CAG needs systems that translate defects into actionable maintenance tasks.
-

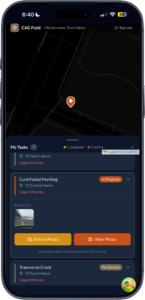
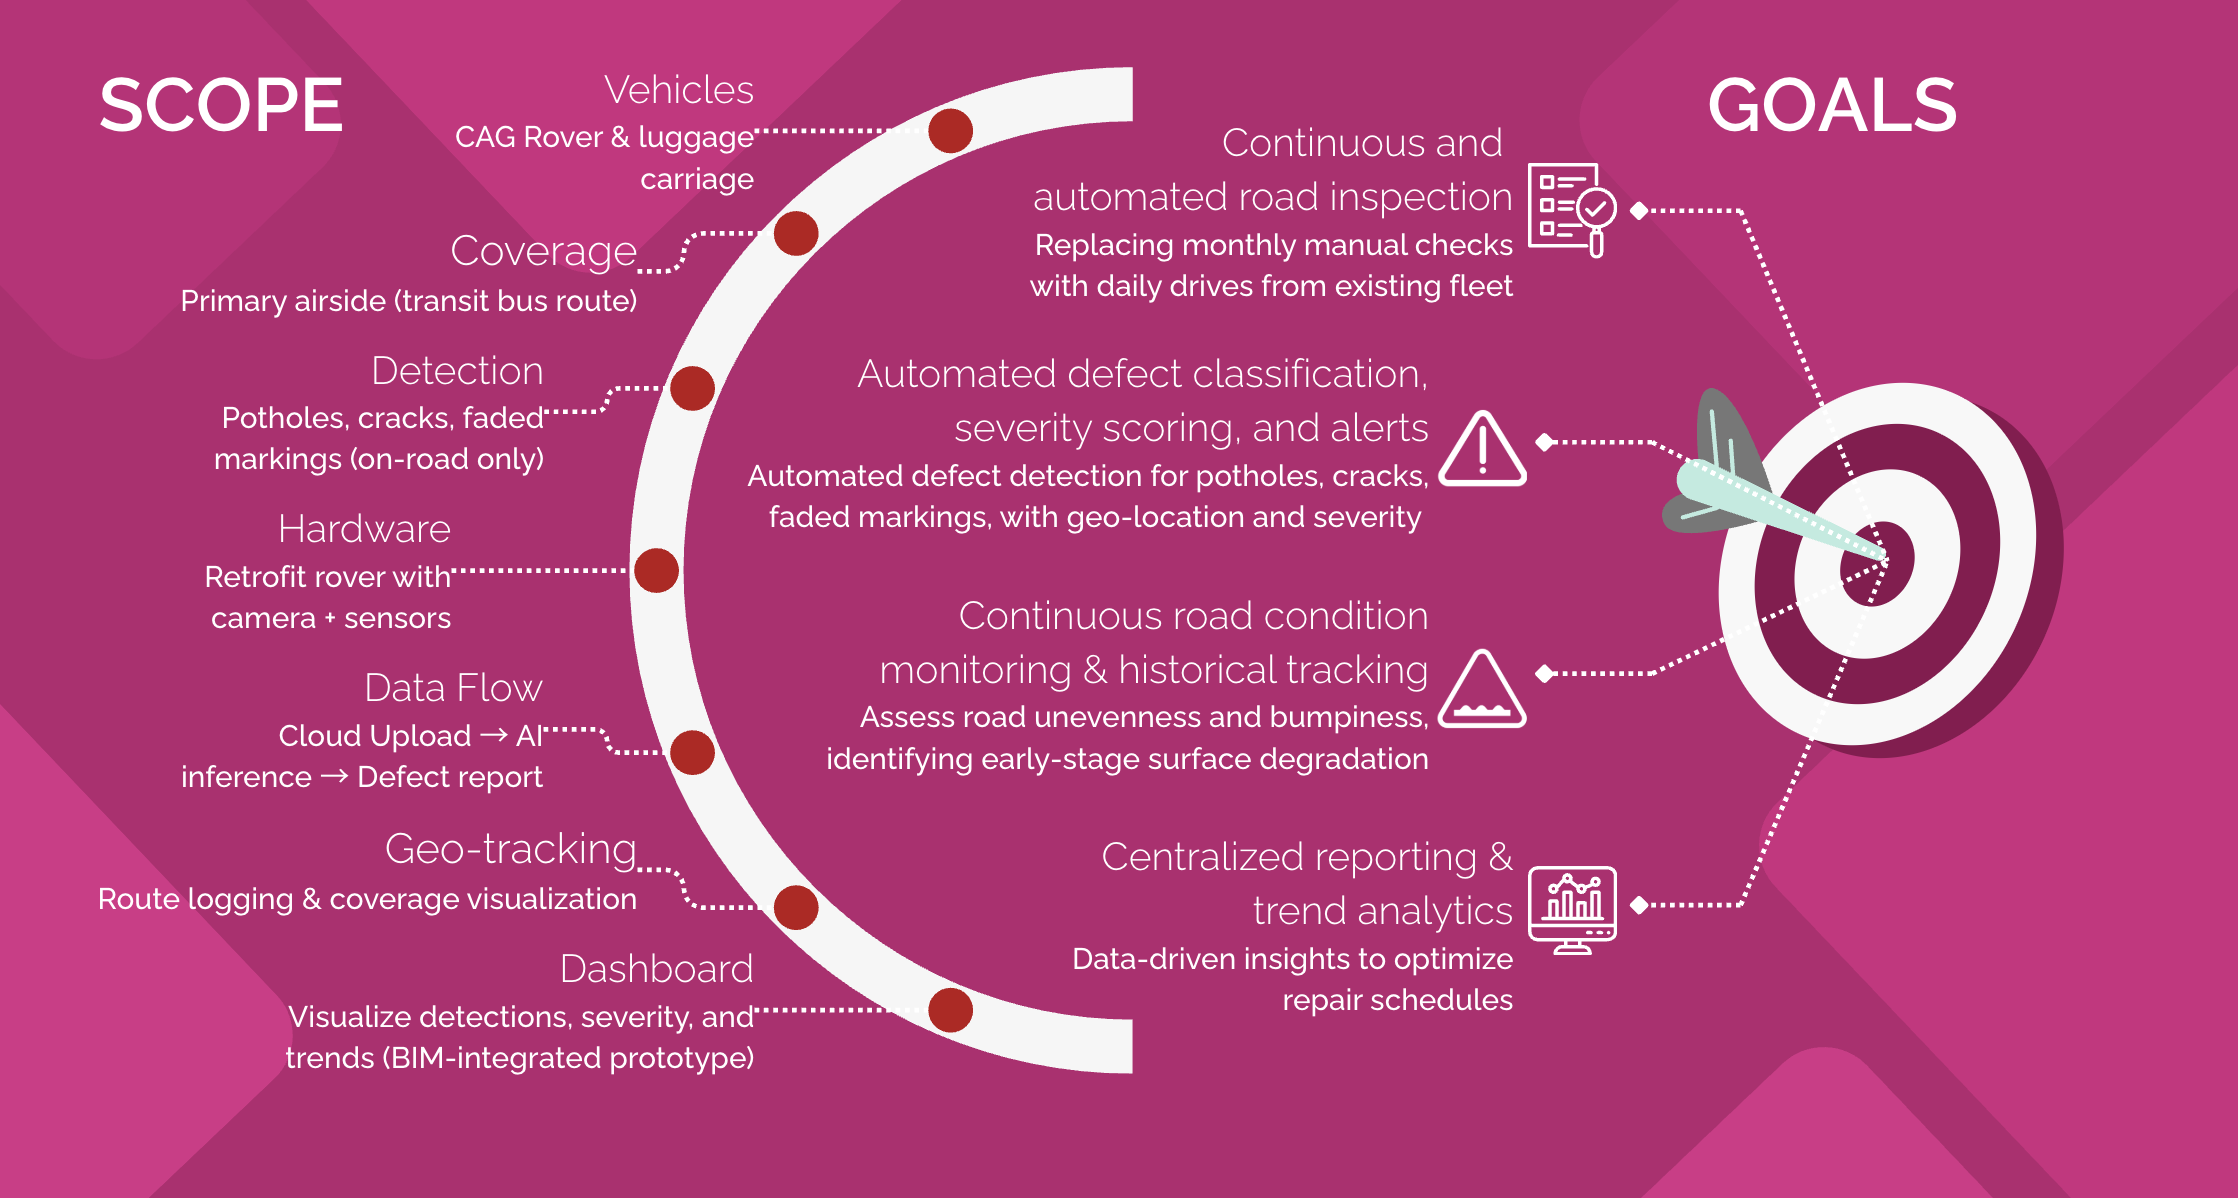
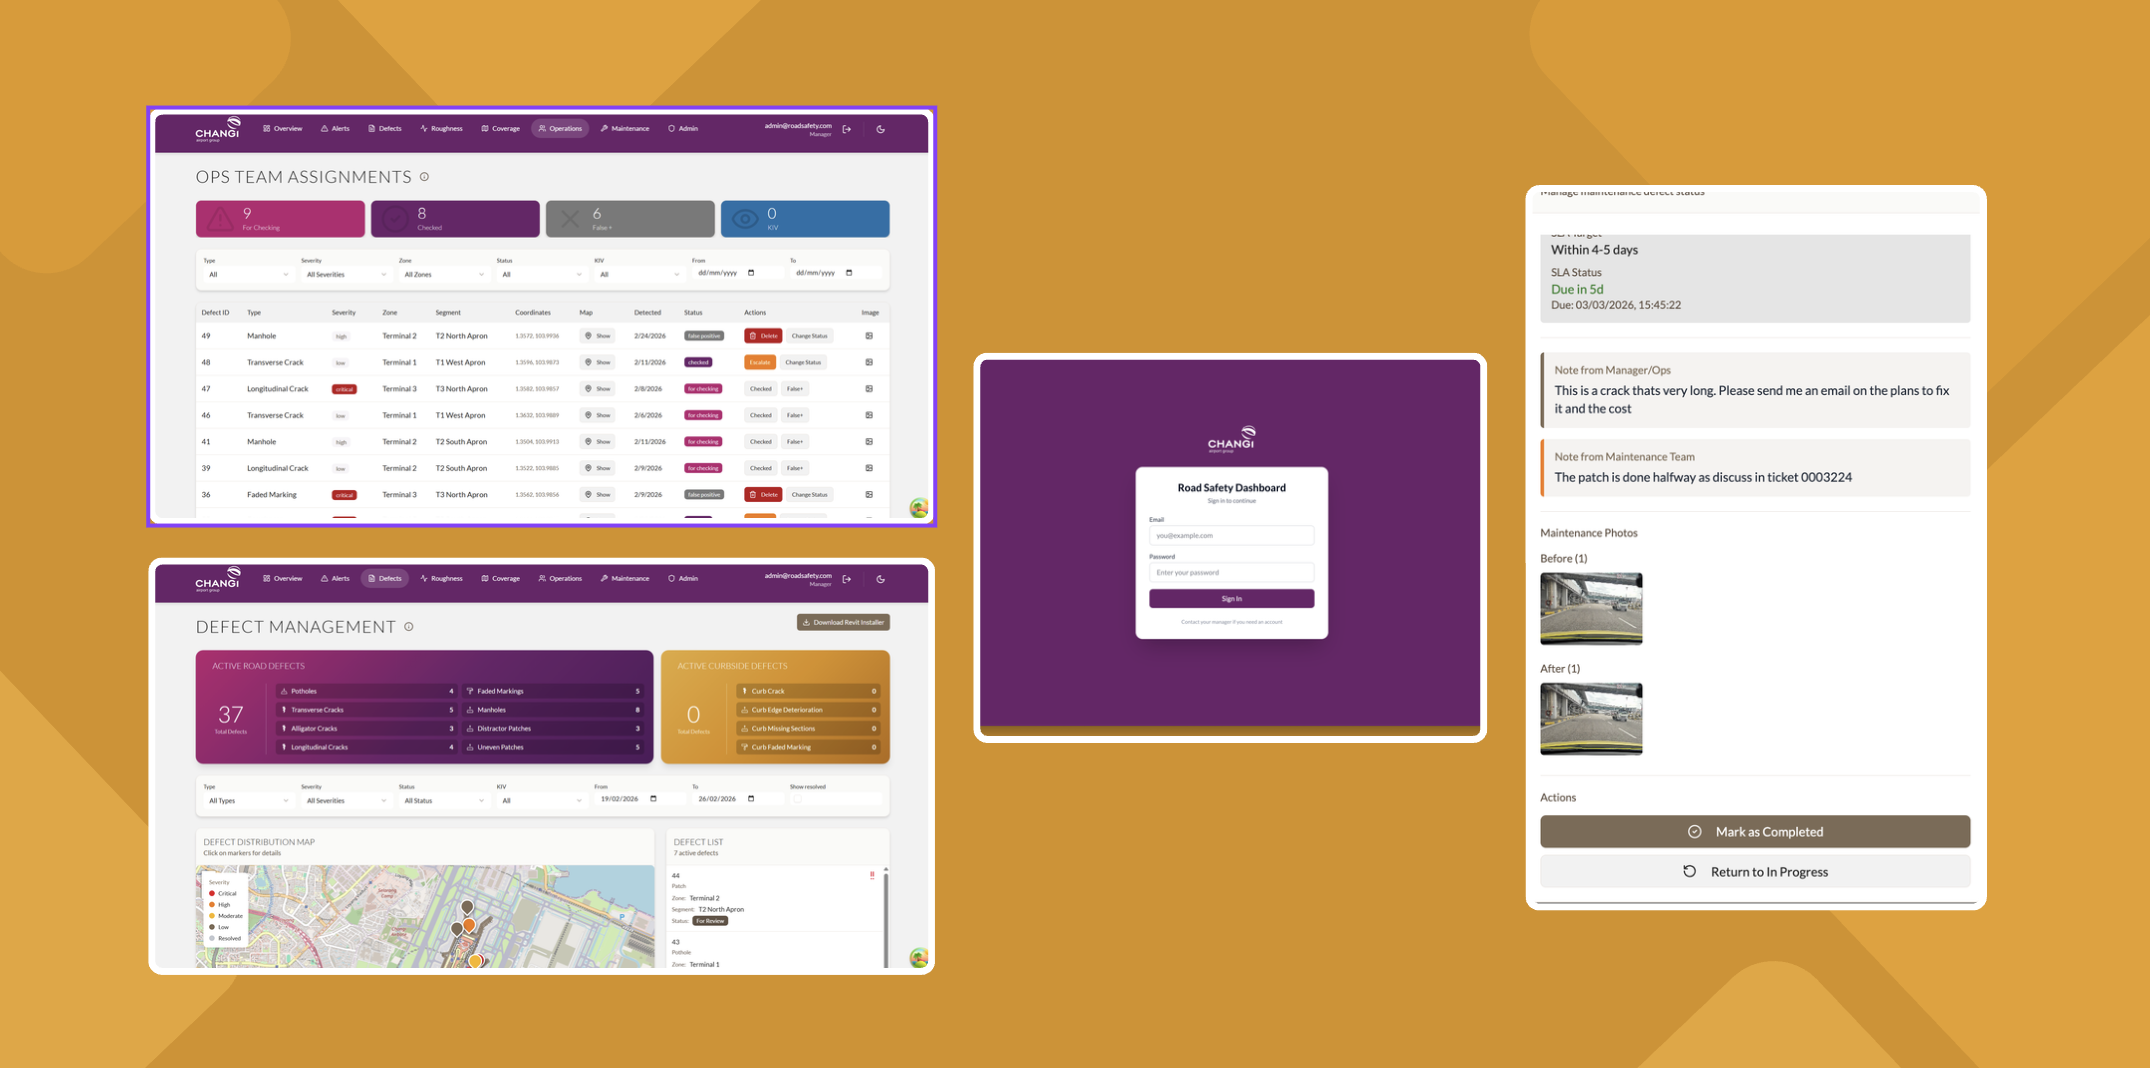
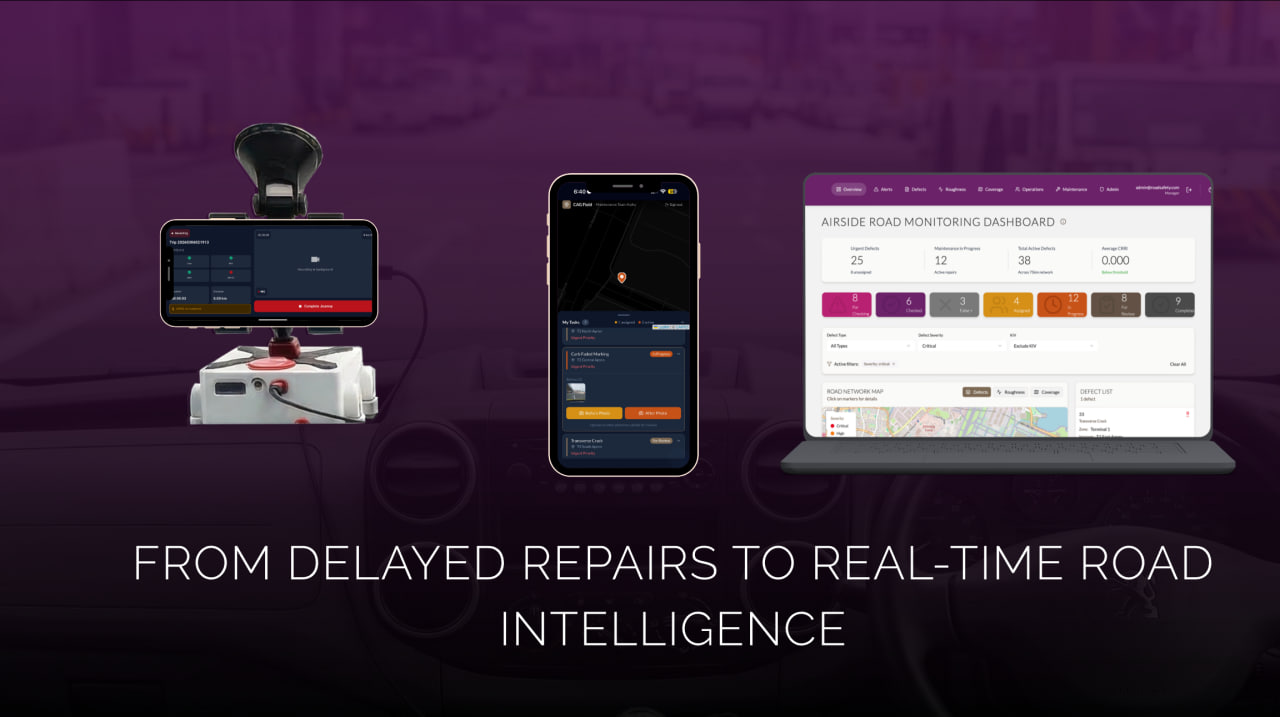
“This solution could significantly shorten the defect detection-to-action cycle.”
-
“Geo-tagged evidence and severity levels would greatly improve maintenance planning.”
-
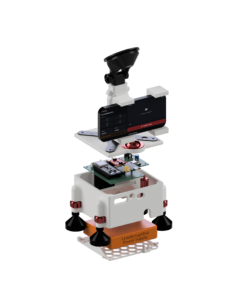
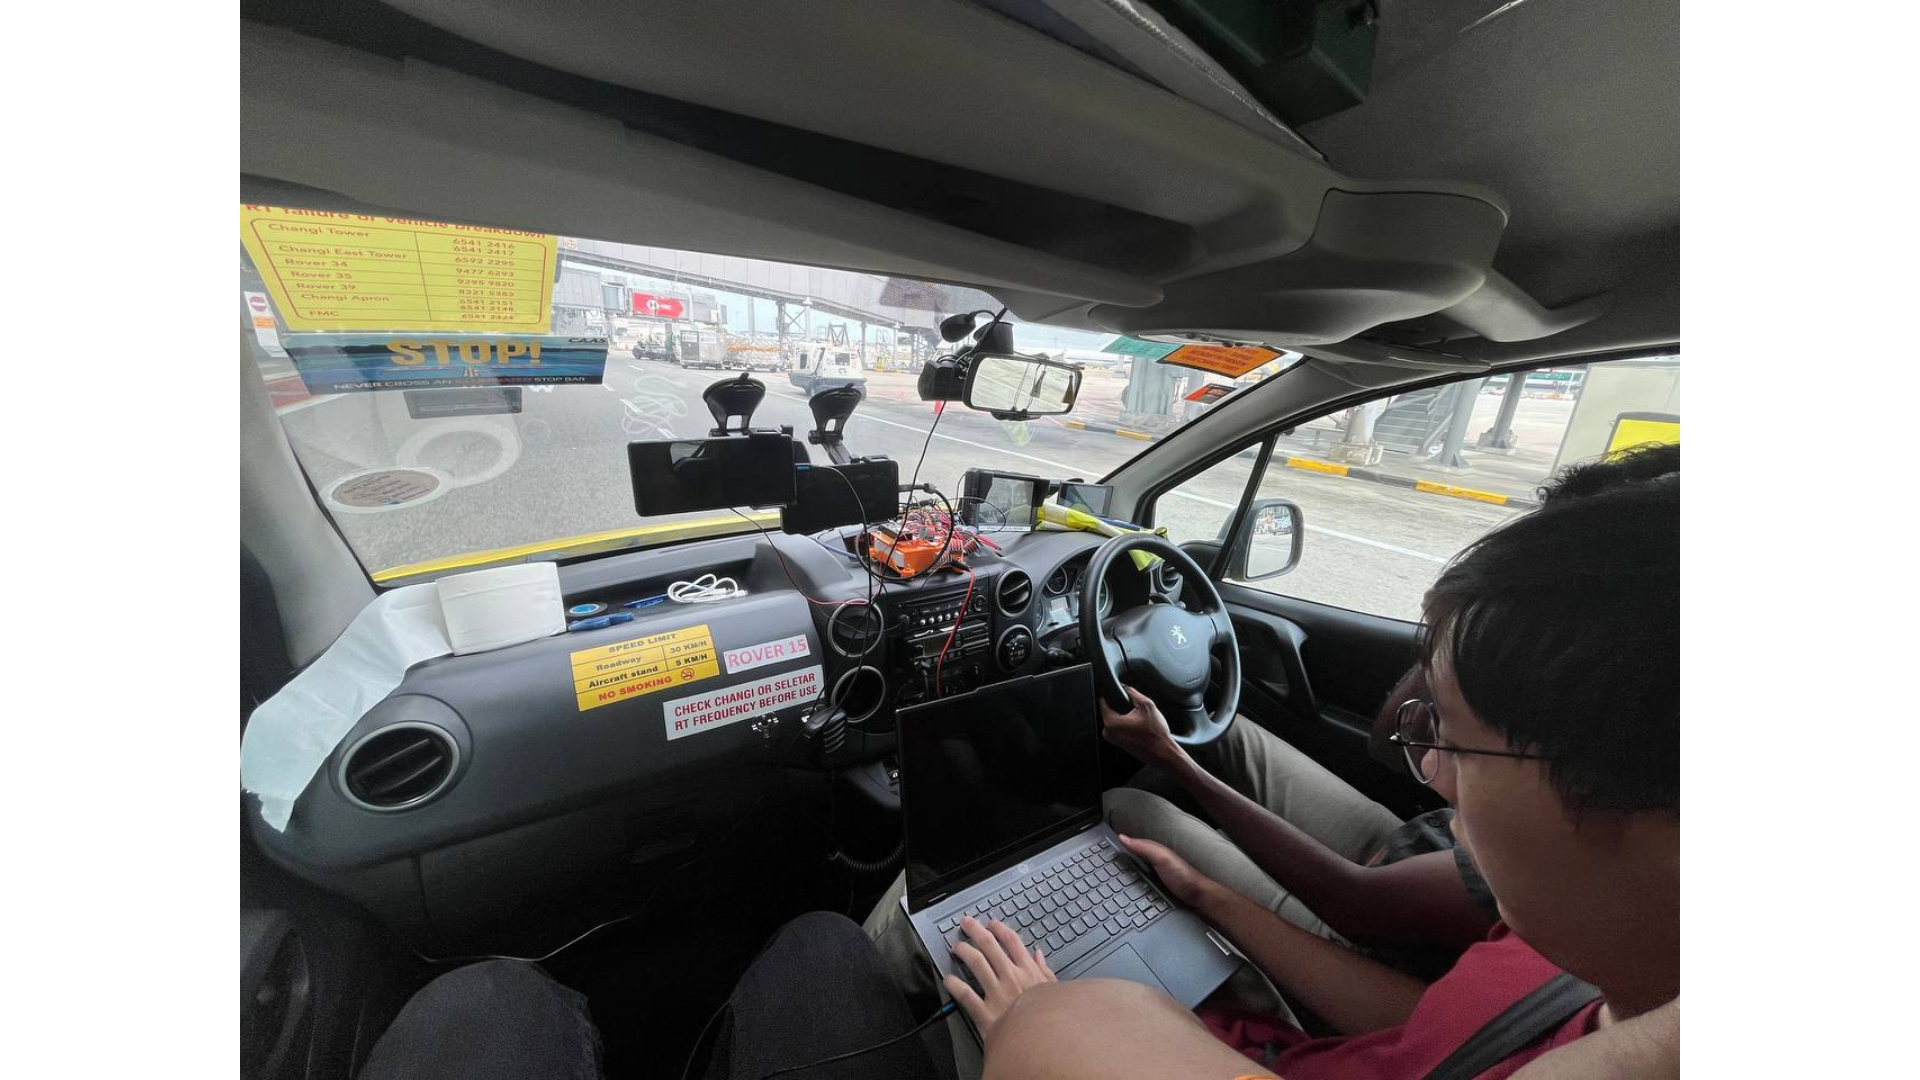
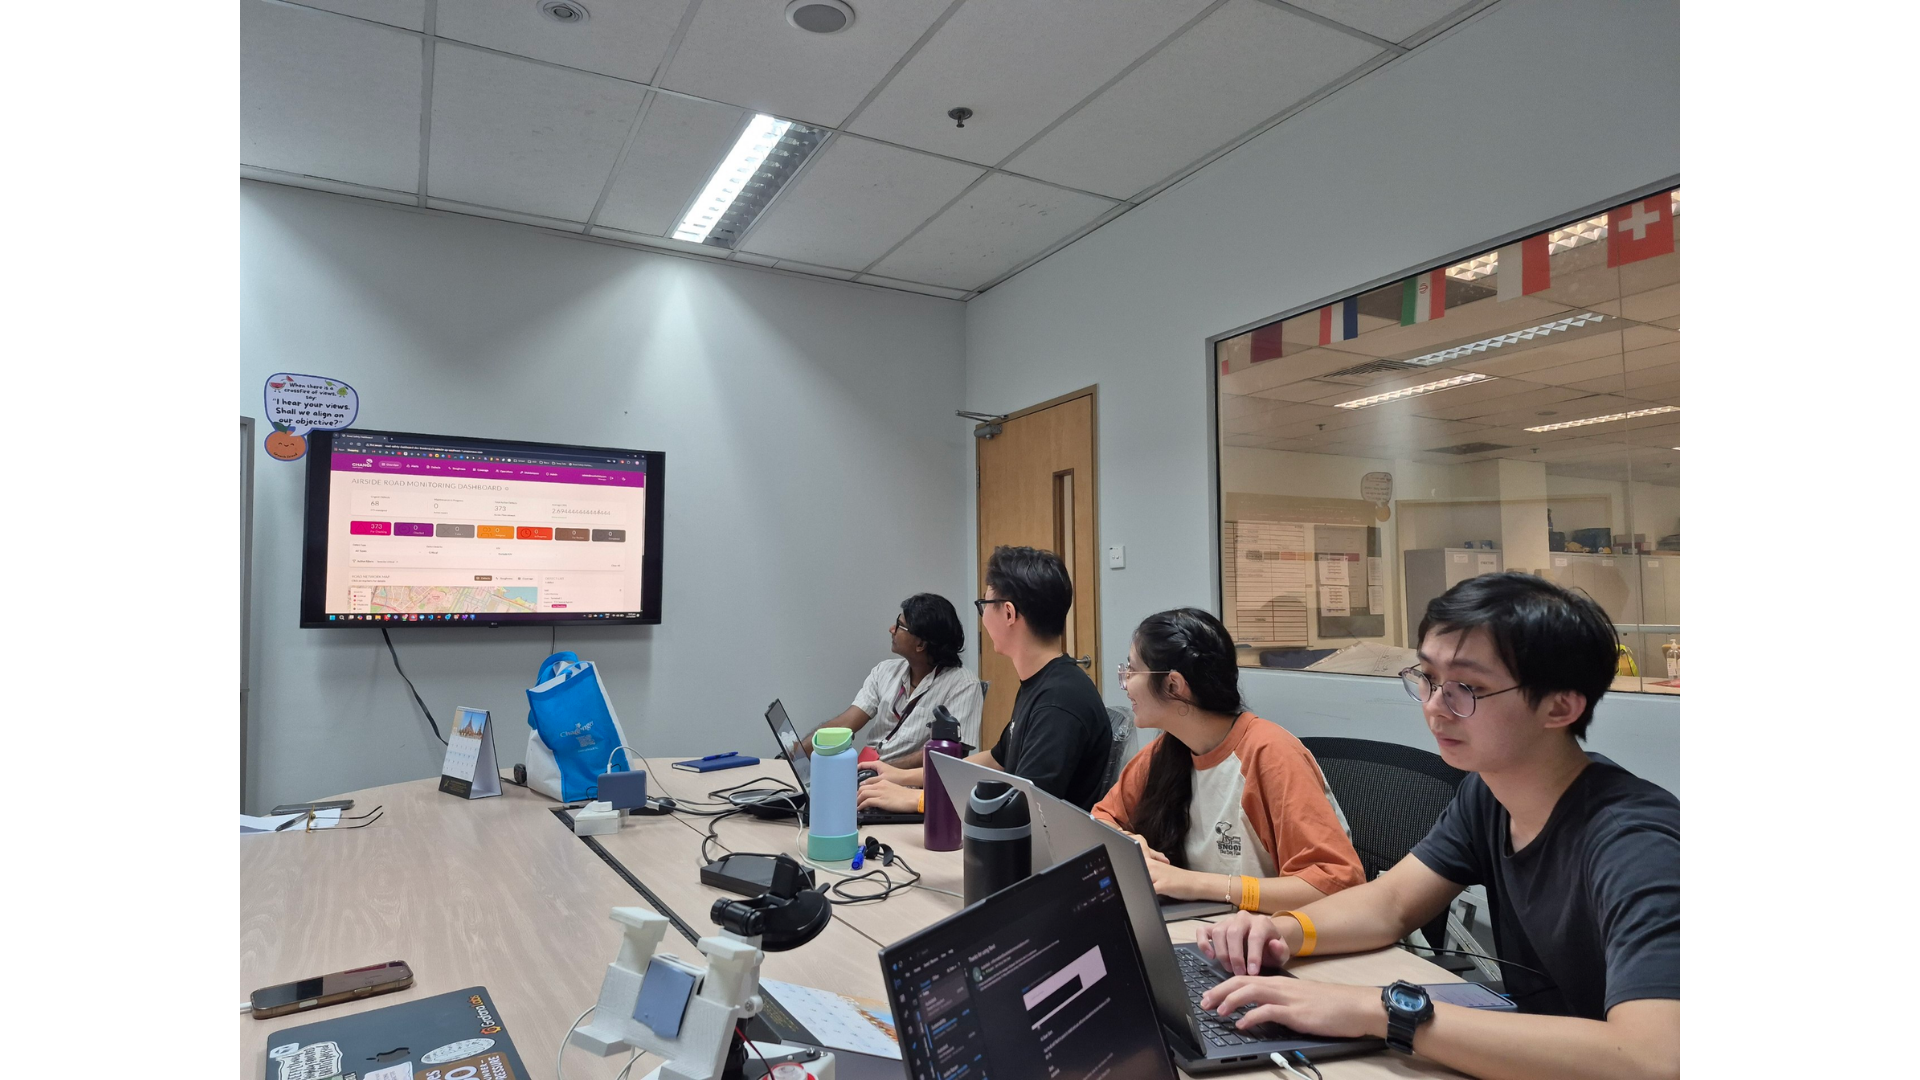
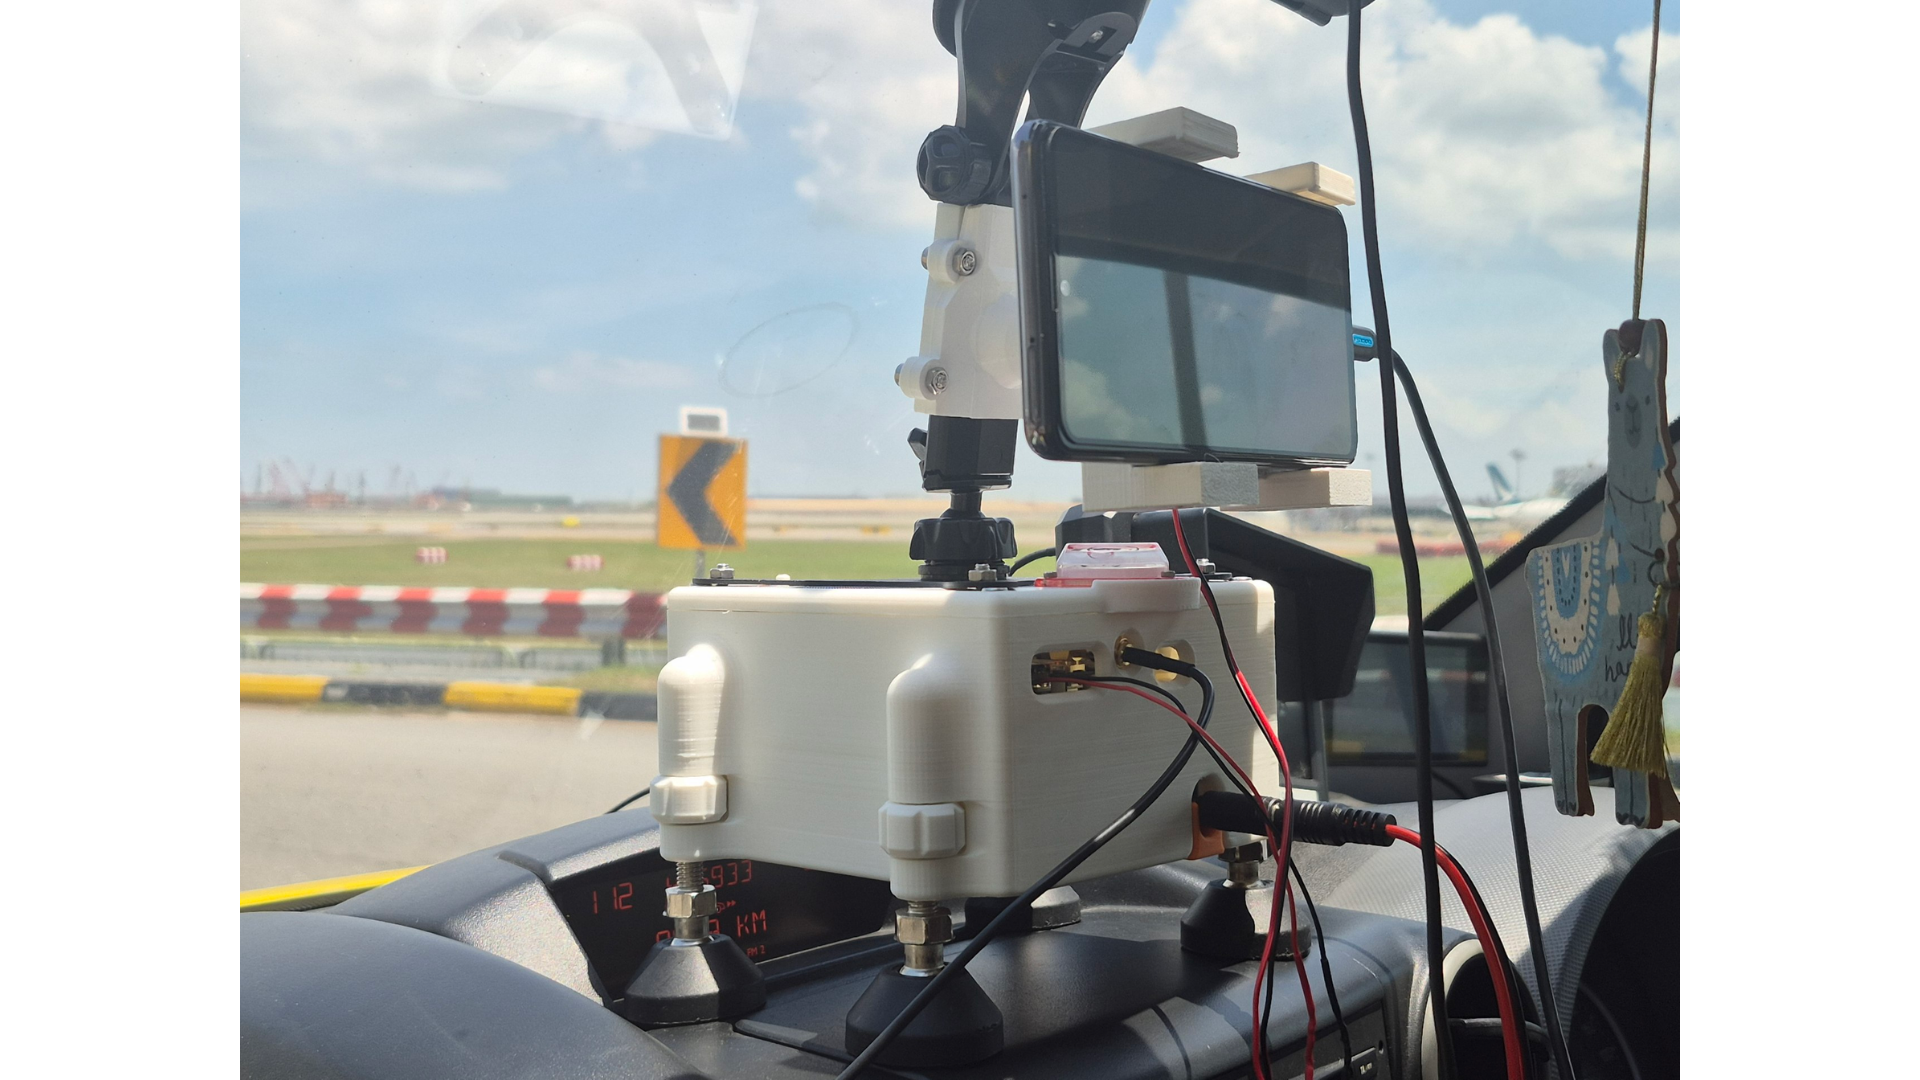
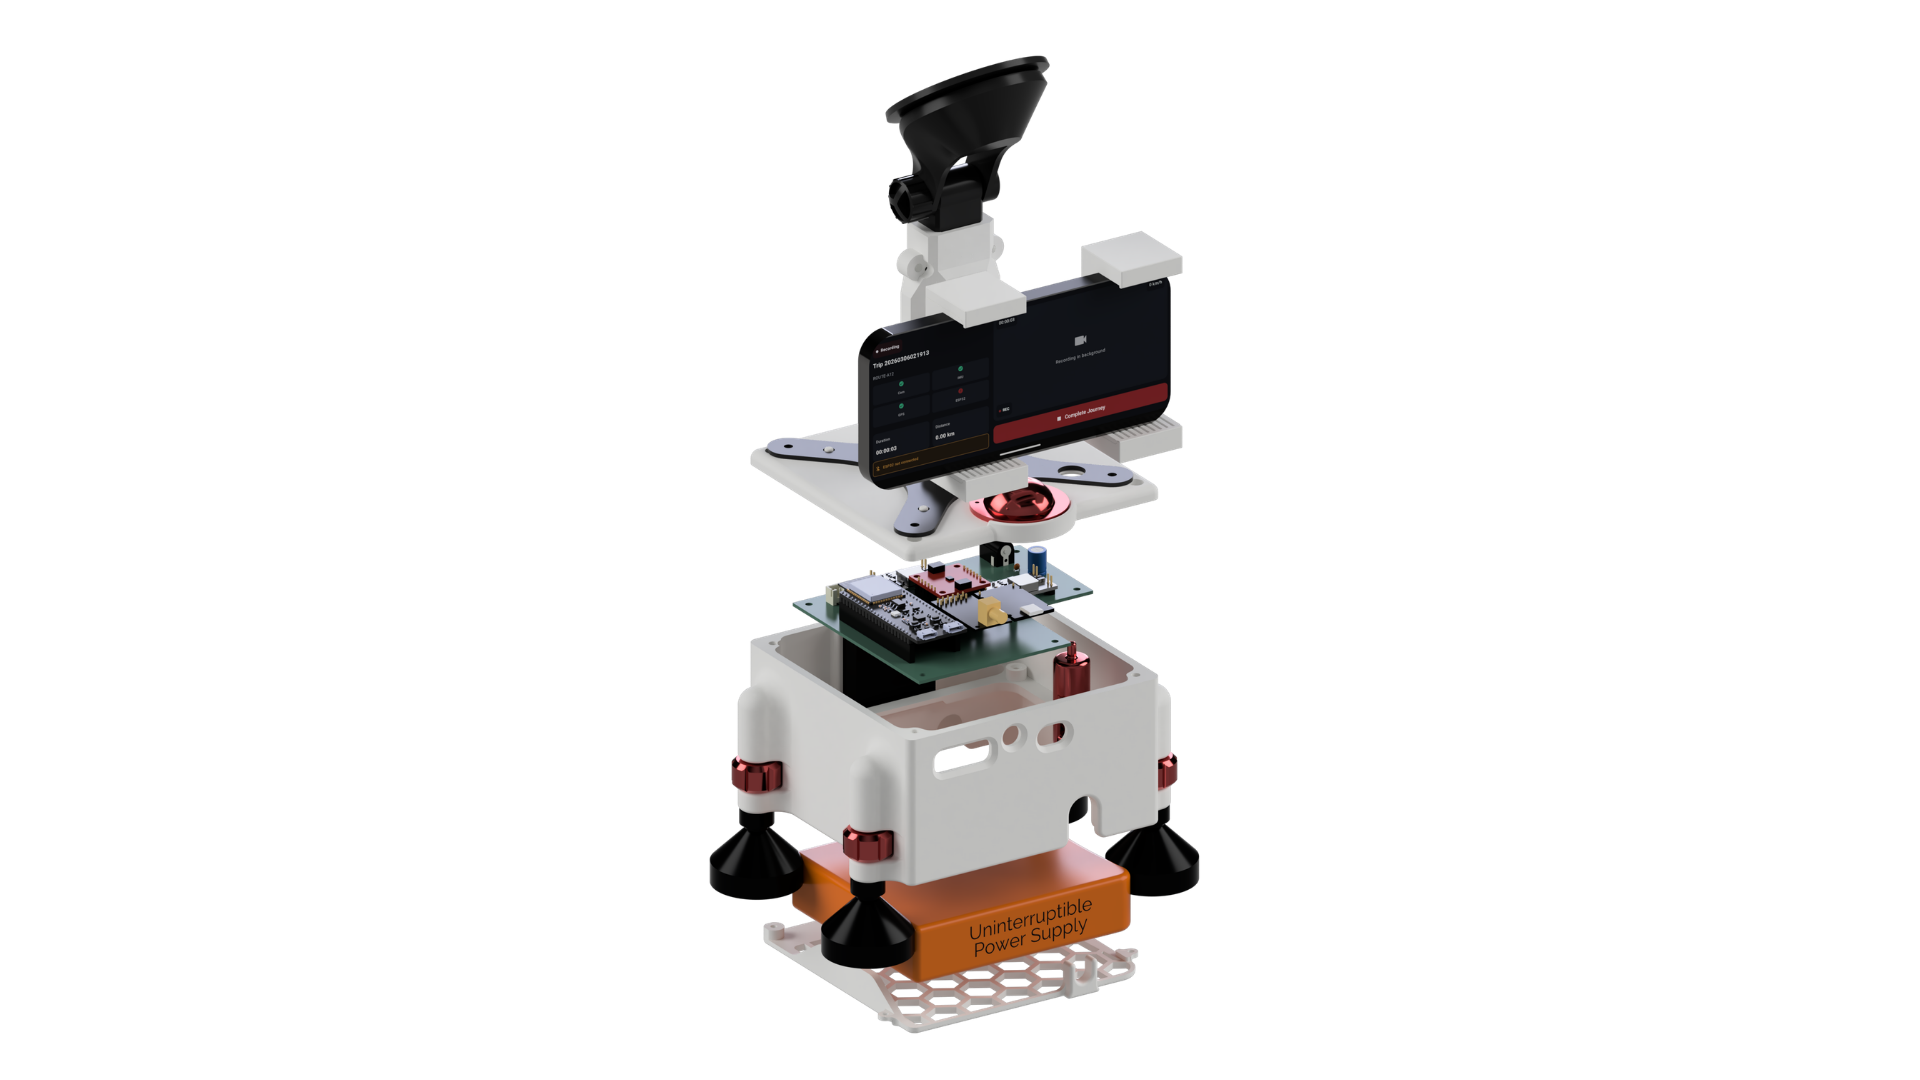
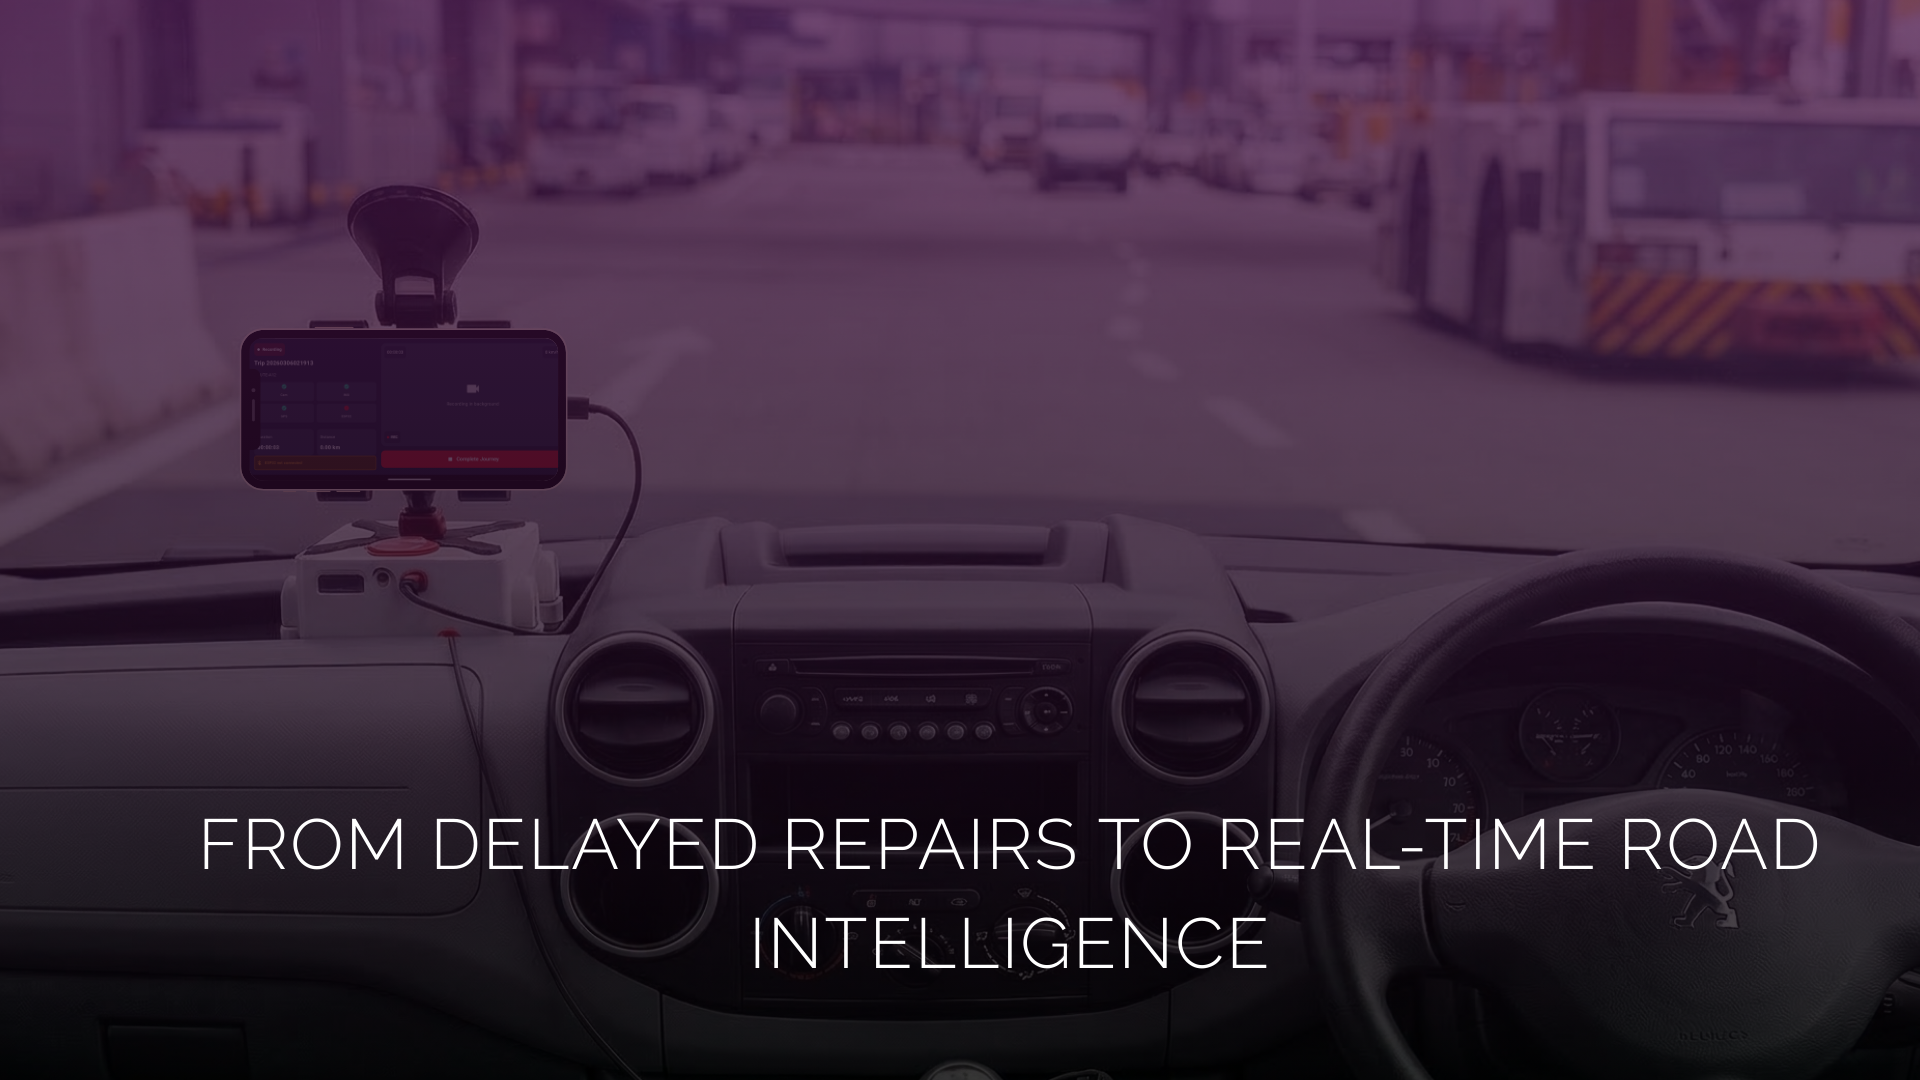
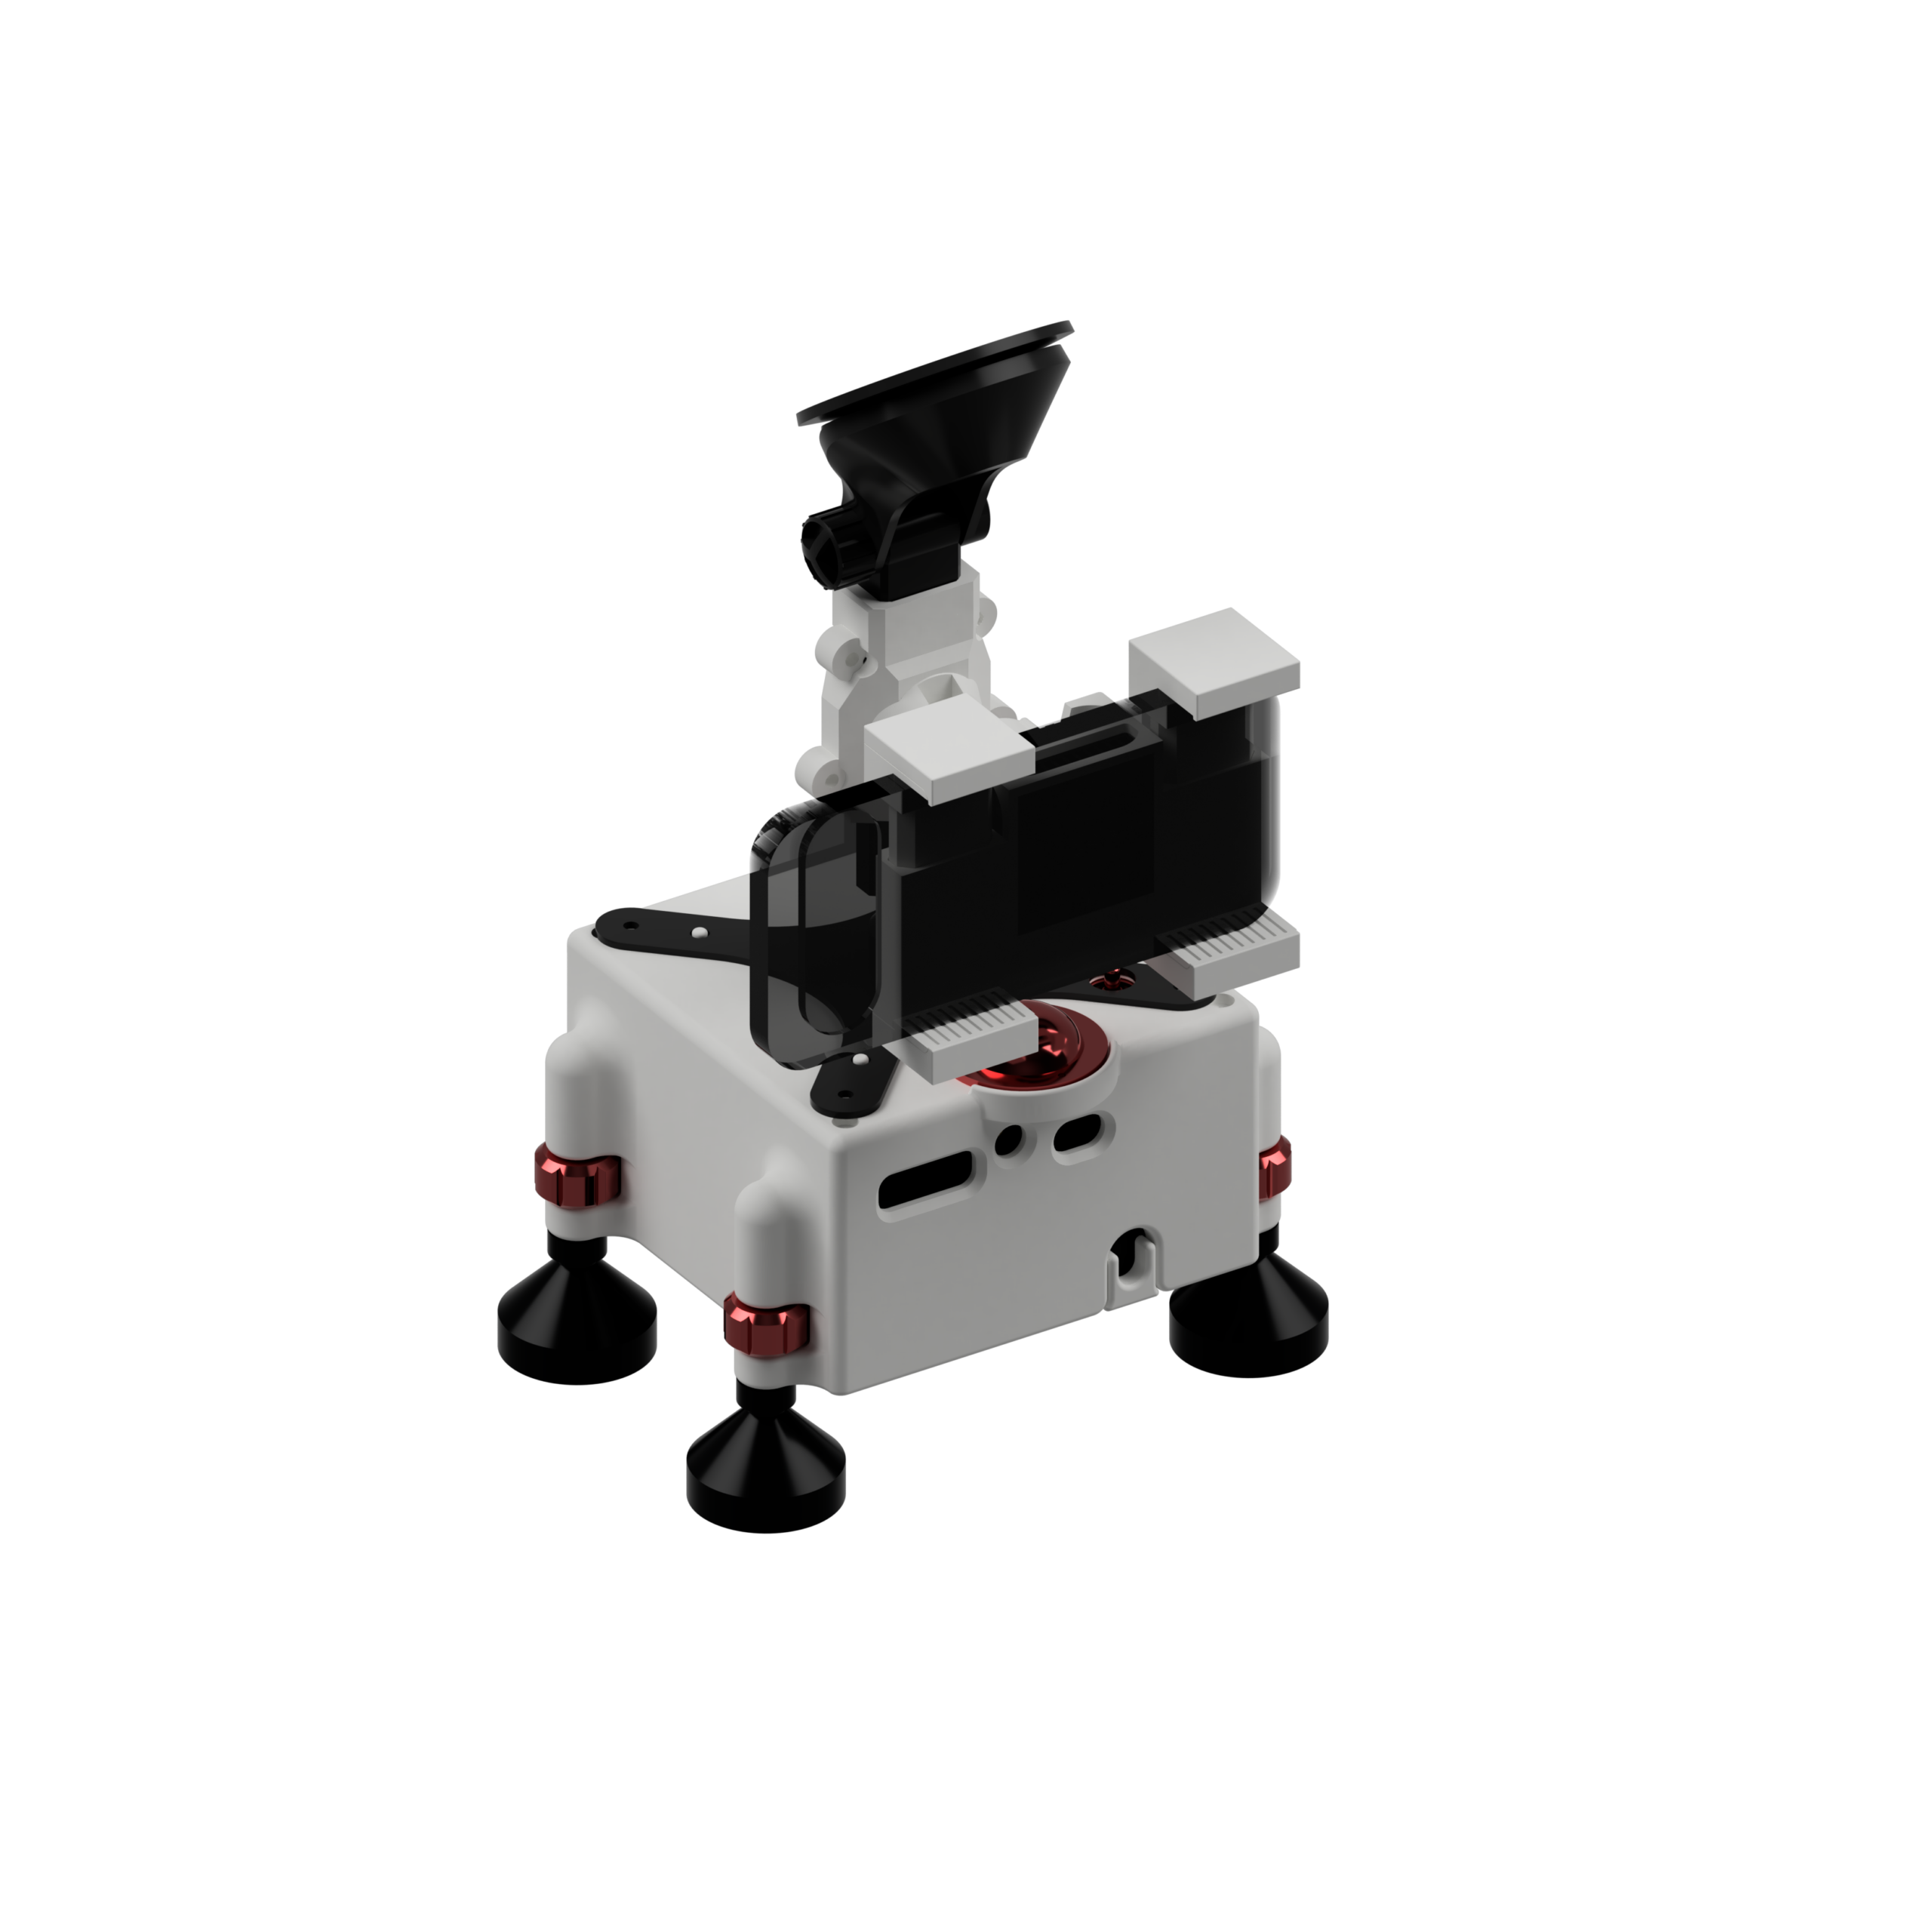
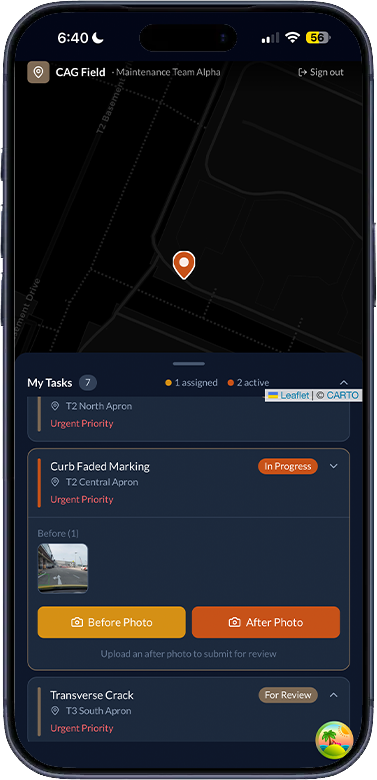
“Deploying this on operational vehicles is a practical approach for routine monitoring.”
-
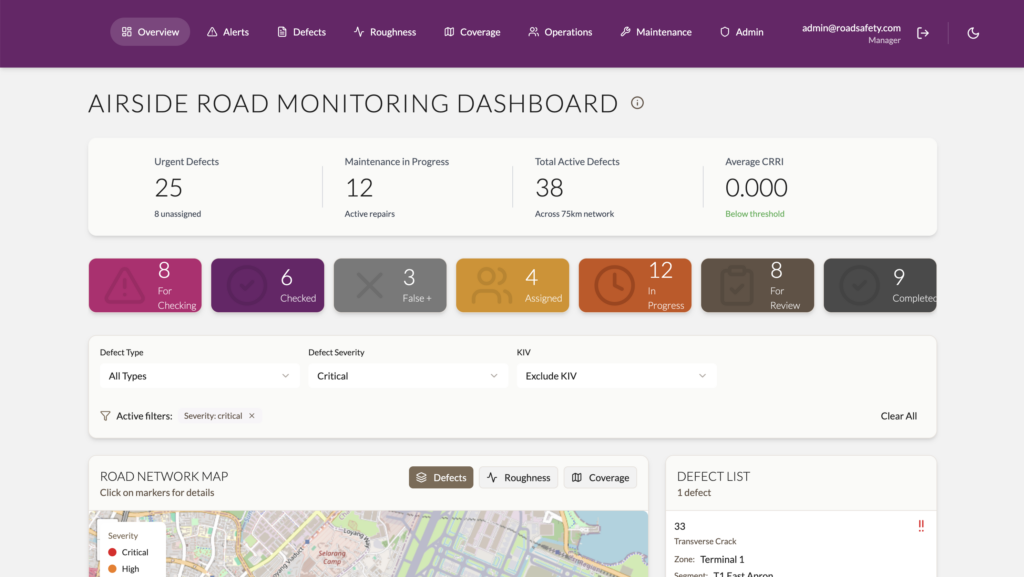
“A defect dashboard would be highly valuable for tracking and recurring hotspot analysis, and is highly beneficial for both operations and long-term planning.”
-
“With strong accuracy and low false positives, this could become a valuable operational tool.”