Our Bottom Line
SMART
Utilising cutting-edge technologies to highlight
vital information of companies and markets.
SIMPLE
Leveraging a user-friendly interface for
effortless and time-saving analyses.
SAFE
Offering comprehensive insights on the market
and companies, forewarning potential risks.
From our final user testing, we found that...

77 minutes
of time savings on average
66%
agreed that the solution leads to an
improvement in financial analysis and research.
69%
agreed that they gained deeper insights
on the company's business.
72%
agreed that the solution is concise
and easy to understand.
Platform Background
Bull Bear Vector (BBV) is an Artificial Intelligence (AI)-driven investment website built by CII. Utilising methodologies from seasoned investors, BBV provides knowledge, tools and support for investors. BBV sets out with the intention to help clients in the both short-term (1 to 5 days) and long-term (1 to 5 years) investment and/or trading in US equities.

Project Description
Smart Investing supercharges the Bull Bear Vector (BBV) Investment Education Platform with AI features and enhanced data visualisations to empower retail investors in their trading and investment endeavours.

Problem: Time-consuming Analysis
Traditional conventional methods of doing thorough due diligence on stocks of interest take up a lot of time and effort for investors and traders. As the existing BBV platform suffers from a lack of qualitative analysis and slow update frequencies, the project aims to tackle the following problem statement:
How might we automate and streamline research on
Bull Bear Vector to offer clear stock insights efficiently?
Solution: Smart Investing
Incorporating the use of AI technology and enhanced data visualisations to provide a simple and intuitive interface to enhance financial analysis and research.
Prototype Design Features
Featuring three distinct reports, Macroeconomic, Sector, and Microeconomic, providing analyses on various aspects of the economy. Click on the tabs to toggle between the reports and features!
Macroeconomic Report
Objective: To provide key insights on the latest trends and happenings of the US economy.
Securities in focus:

Features:
Key Year Events
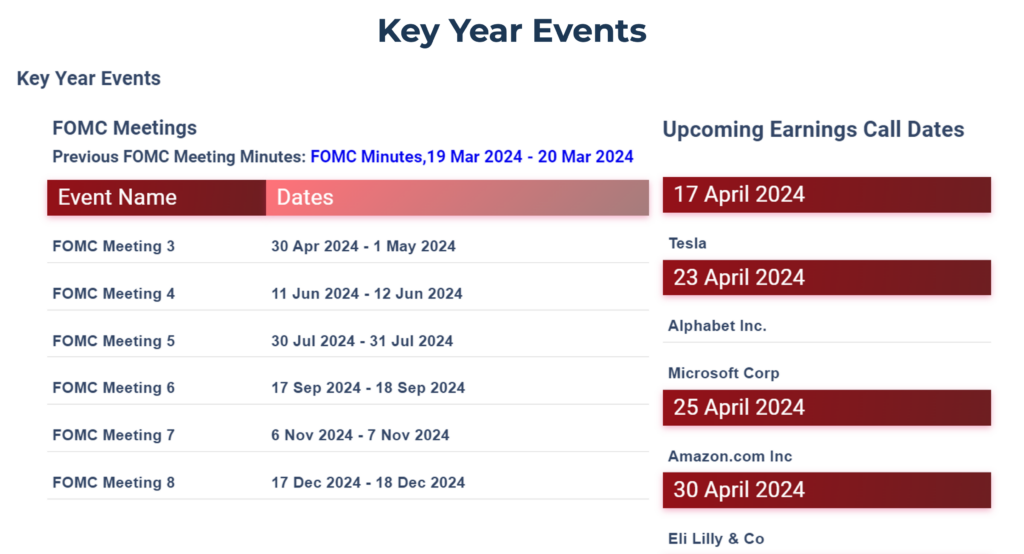
Provides users with the dates of upcoming Federal Open Market Committee (FOMC) meetings, and upcoming earnings call dates for the top 10 companies in the S&P 500 Index. The intent is to forewarn potential volatility in the US economy around the upcoming event dates.
Monthly Seasonality Chart
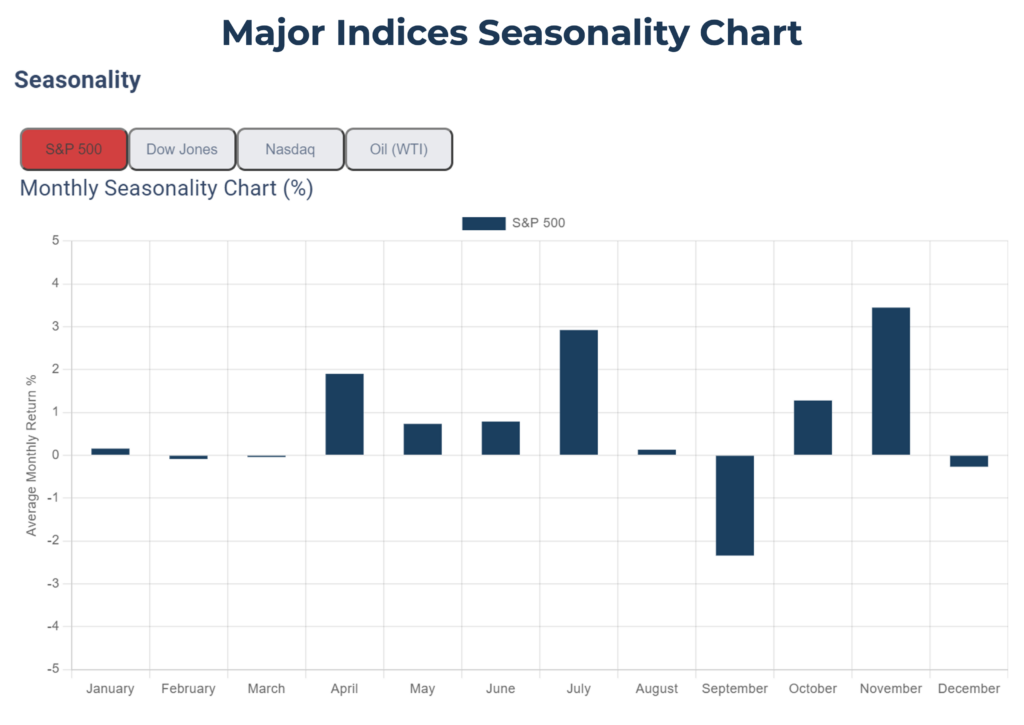
Provides users with the average returns for each month over a trailing 20 year period, indicating which months tend to have an uptrend or downtrend.
Market News Summary
Provides a succinct summary of the latest news within the US economy. The summarisation is categorised into 4 segments:
• Financing Activities and Manpower
• Geopolitics
• Oil and Commodities
• Federal Key Indicators Forecasts
Through Retrieval Augmented Generation (RAG), the latest news of the US market is screened through to extract qualitative insights.
Sector Report
Objective: To provide key insights on the performance and trends for the 11 sectors in the US economy.
Securities in focus:

Features:
Industry Allocation
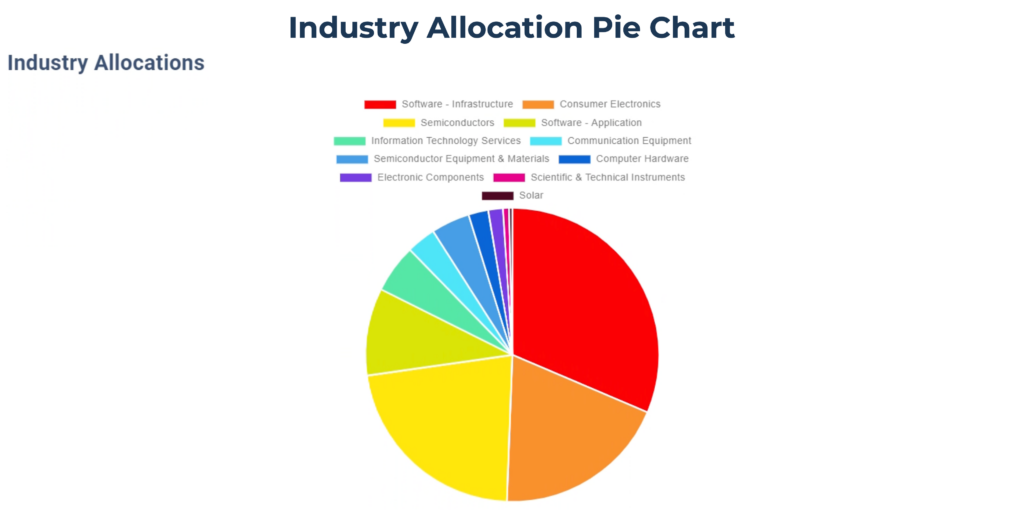
Provides a breakdown of the industries within a given sector ETF. The distribution of industries is presented in a pie chart, with each company partaking in 1 main industry. From the pie chart, investors can identify which industries are driving the prices of the given sector ETFs.
Top Holdings
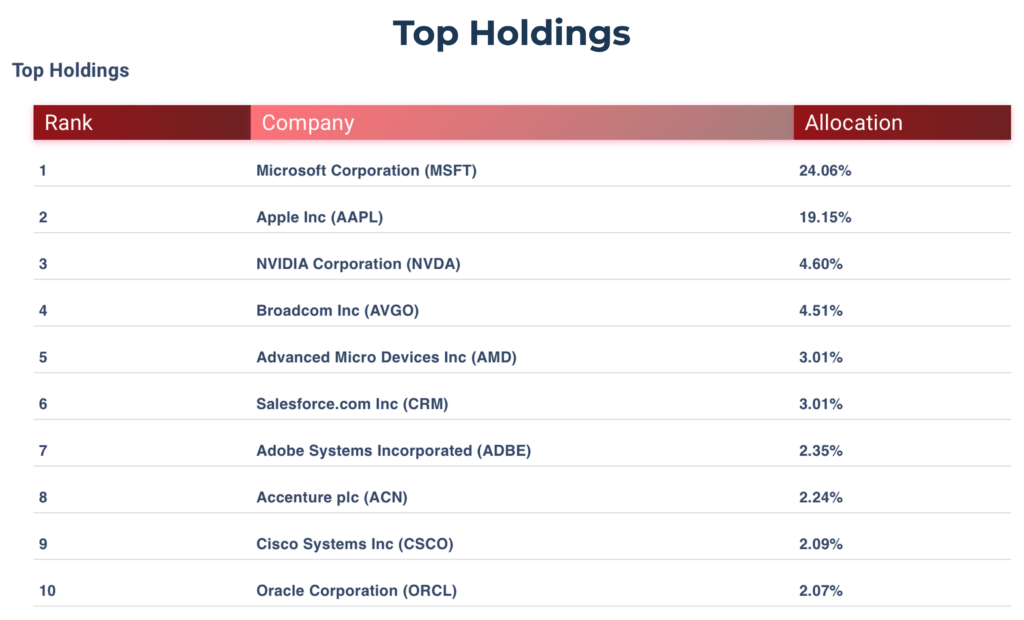
The top 10 companies within a given sector are ranked by the highest allocation percentage first. This helps users identify the main companies driving the prices of a given sector ETF.
Key Financial Ratios

Provides essential ratios such as "Earnings Per Share" (EPS) and "Price-to-Earnings" (P/E), reflecting the performance and valuation of a given sector ETF.
Market Capitalisation Comparison
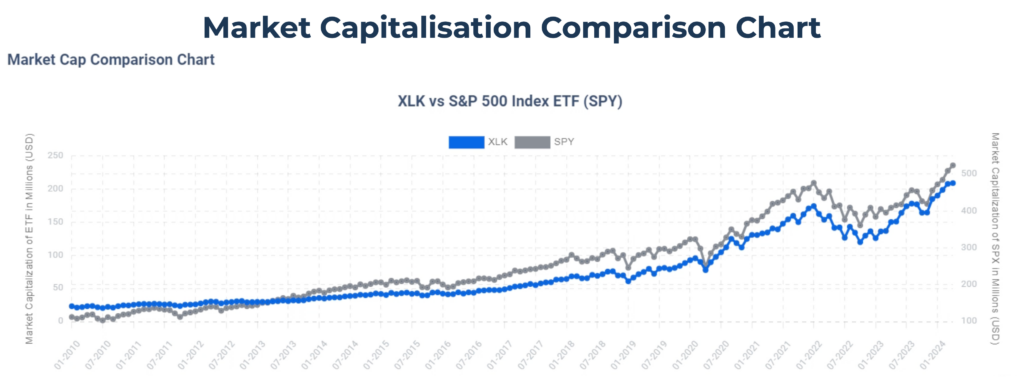
Compares the market capitalisation of the user-selected SPDR Select Sector ETF with the S&P 500 Index ETF (SPY), to gauge whether the sector is on par, underperforming, or outperforming the US economy.
Microeconomic Report
Objective: To provide key insights on the performance and trends of publicly-traded companies.
Securities in focus:

Features:
Drivers and Risks (AI-powered feature)
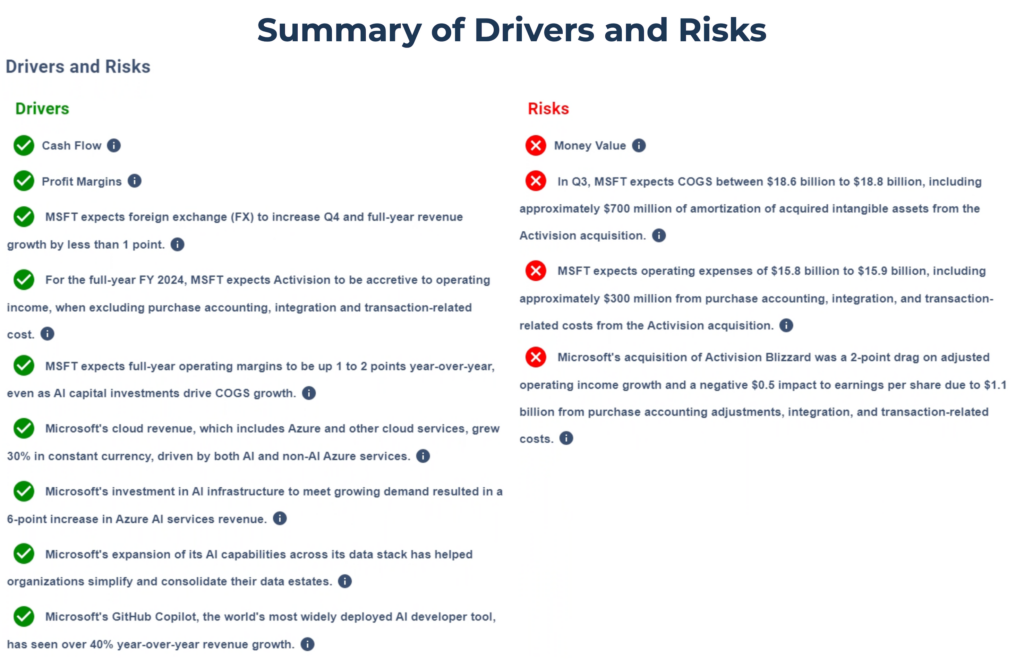
Outlines significant quantitative and qualitative insights of the company that would drive or pose a threat to the company's valuation and prospective outlook. These insights are delivered in a clear, intuitive manner for ease of use and comprehension.
10 Year Financial Statement
Highlights the historical and latest financial earnings of the company, comparing metrics with analyst expectations and other financial values.
Earnings Call Transcript Summary (AI-powered feature)
Summarises significant insights from the latest earning call transcript from the user-selected company. The summarisation is broken down into the following 5 segments:
• Overall Performance and Key Highlights
• Breakdown of Business Segments
• New Developments and Projects
• Company Outlook
• Government Regulations
News Summary (AI-powered feature)
Summarises significant insights from the latest news about the company. The summarisation is broken down into the following 4 segments:
• Analyst Opinions
• Recent Price Movements
• Government Regulations
• Company Announcements
Through Retrieval Augmented Generation (RAG), the latest news of a company is screened through to extract qualitative insights.
Technology Stack
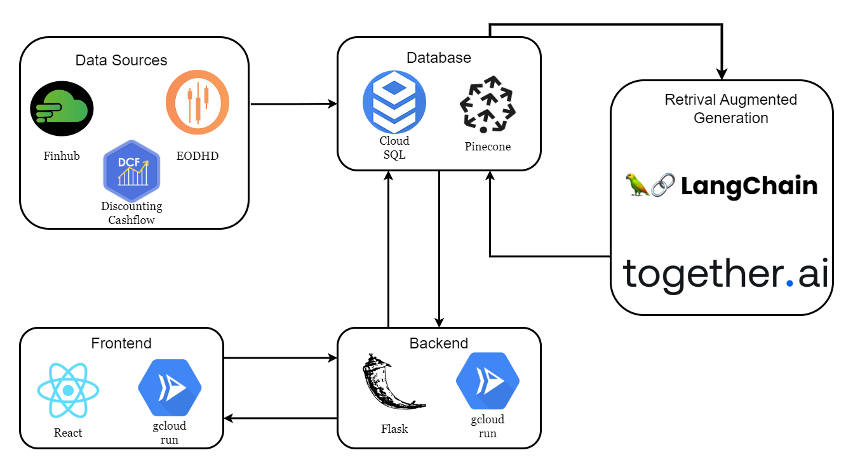
1. System Architecture
The dashboard app's innovative architecture combines cutting-edge technologies to deliver high performance, AI-powered reports integrating diverse data sources.
With an intuitive React frontend and a scalable Flask backend on Google's robust cloud infrastructure, the architecture offers a future-proof solution for data-driven decision-making.
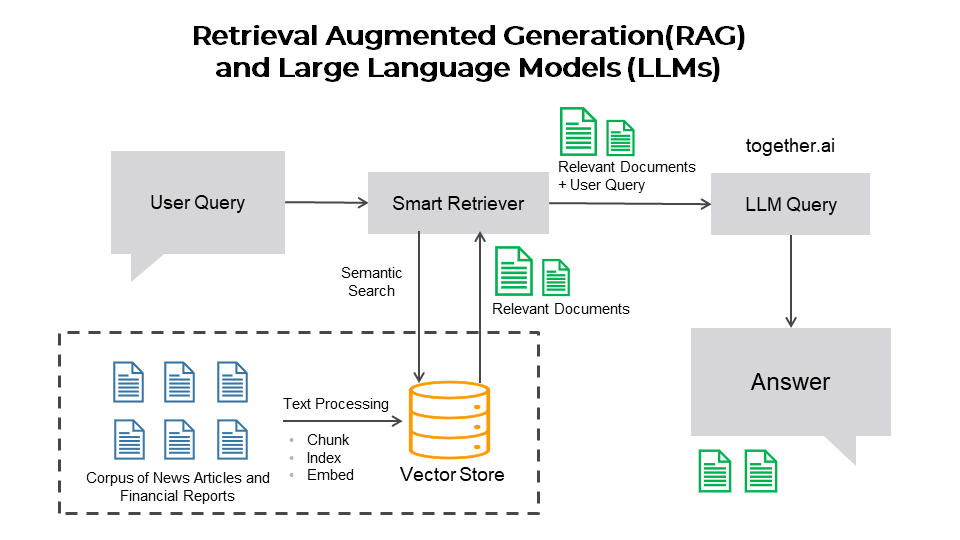
2. RAG and LLM Pipeline
The Retrieval Augmented Generation (RAG) pipeline integrates robust data preparation, smart retrievers, and state-of-the-art Large Language Models (LLMs) to deliver accurate, contextualised responses.
Accompanied by transparent citations, this cutting-edge architecture empowers users with dynamic insights for qualitative analysis.
In Collaboration With

Special Thanks
We would like to extend our heartfelt gratitude to Jeremy, Waimin, Ram and Nitin for guiding us through the entire journey of our capstone.
Lest we forget, we would not have made it this far and pushed our mental boundaries without our capstone and writing instructor-mentors! Thank you Prof Zhao Fang and Dr. Bernard Tan for your tireless and priceless advice and supervision.


