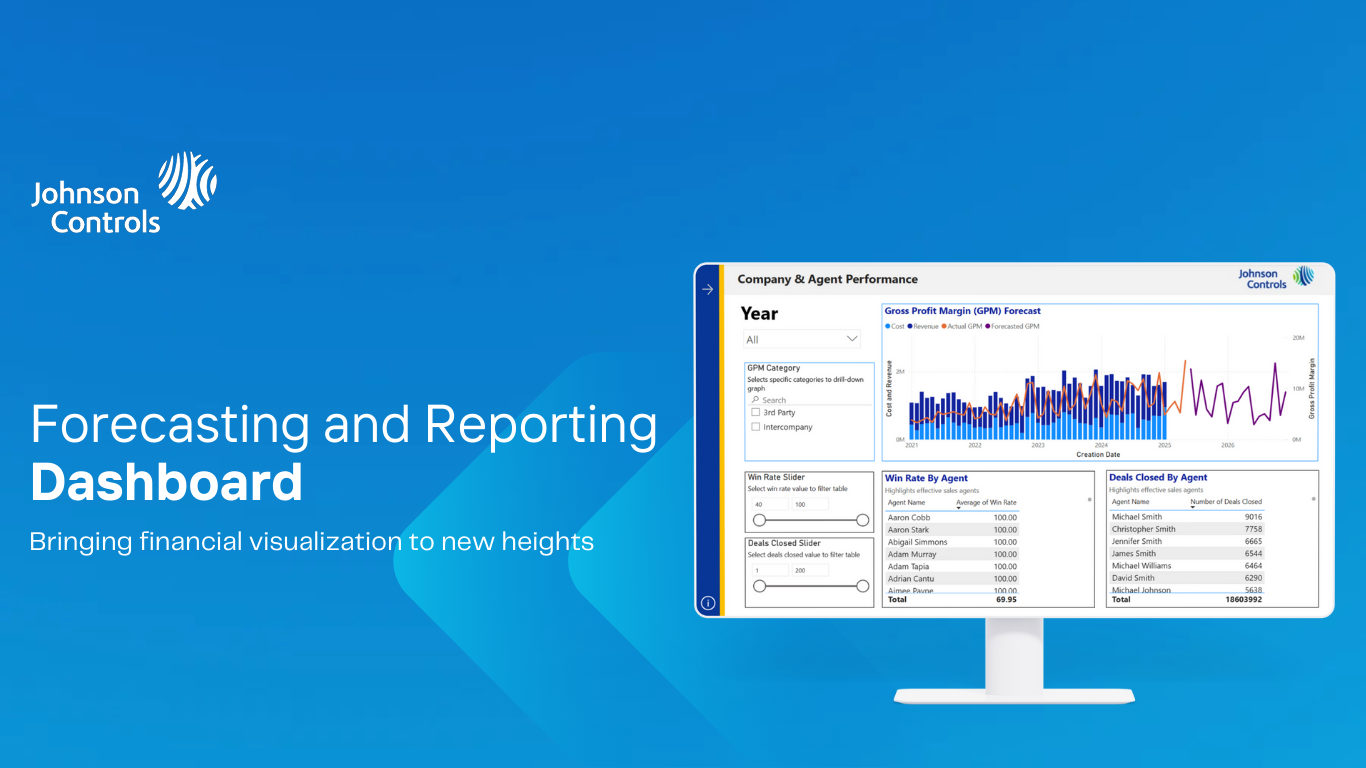
Predictive Forecast and Reporting (S36)

Empowering Data Visualisation with Machine Learning

A dashboard with accurate sales forecasts and real-time key metrics with scheduled data refresh

By using machine learning techniques, including regression, time series analysis, and classification models, this AI-powered predictive sales reporting solution is able to forecast sales performance, analyse key metrics, and identify the causes for targeted interventions. The insights generated are presented through a Power BI dashboard to support the leadership team in making informed business decisions.

Team members

Vainavi (CSD), Chow Zhe Hui (ESD), Lim Jie Han (CSD), Mahima Sharma (CSD), Fannisa Fahmi (ESD), Wong Oi Shin (CSD)

Instructors:

  • Xiong Zehui

Writing Instructors:

  • Rashmi Kumar

  • Dominic Quah

USER

Johnson Controls is a global leader in building products with a massive sales footprint. Extensive sales data is generated and collected by the company across its diverse product lines over many years. The company is looking for an effective dashboard for summarising sales performance and providing insightful sales forecasts.

Logo of Johnson Controls

Up to 70% of a sales agent’s time is spent on non-selling data-related tasks.

PROBLEM

Johnson Controls’s sales team would spend most of their time on non-selling data-related tasks such as data analysis and performance forecasting. They needed a centralised platform for sales performance visualisation and forecasting to overcome manual data bottlenecks and allow performance tracking across various dimensions.

Our Solution

We have designed a predictive sales dashboard on that empowers Johnson Controls with actionable insights into their sales performance. By leveraging sales data, we identified key metrics that provide a comprehensive overview of the company's business operations and market trends, helping stakeholders monitor performance effectively.

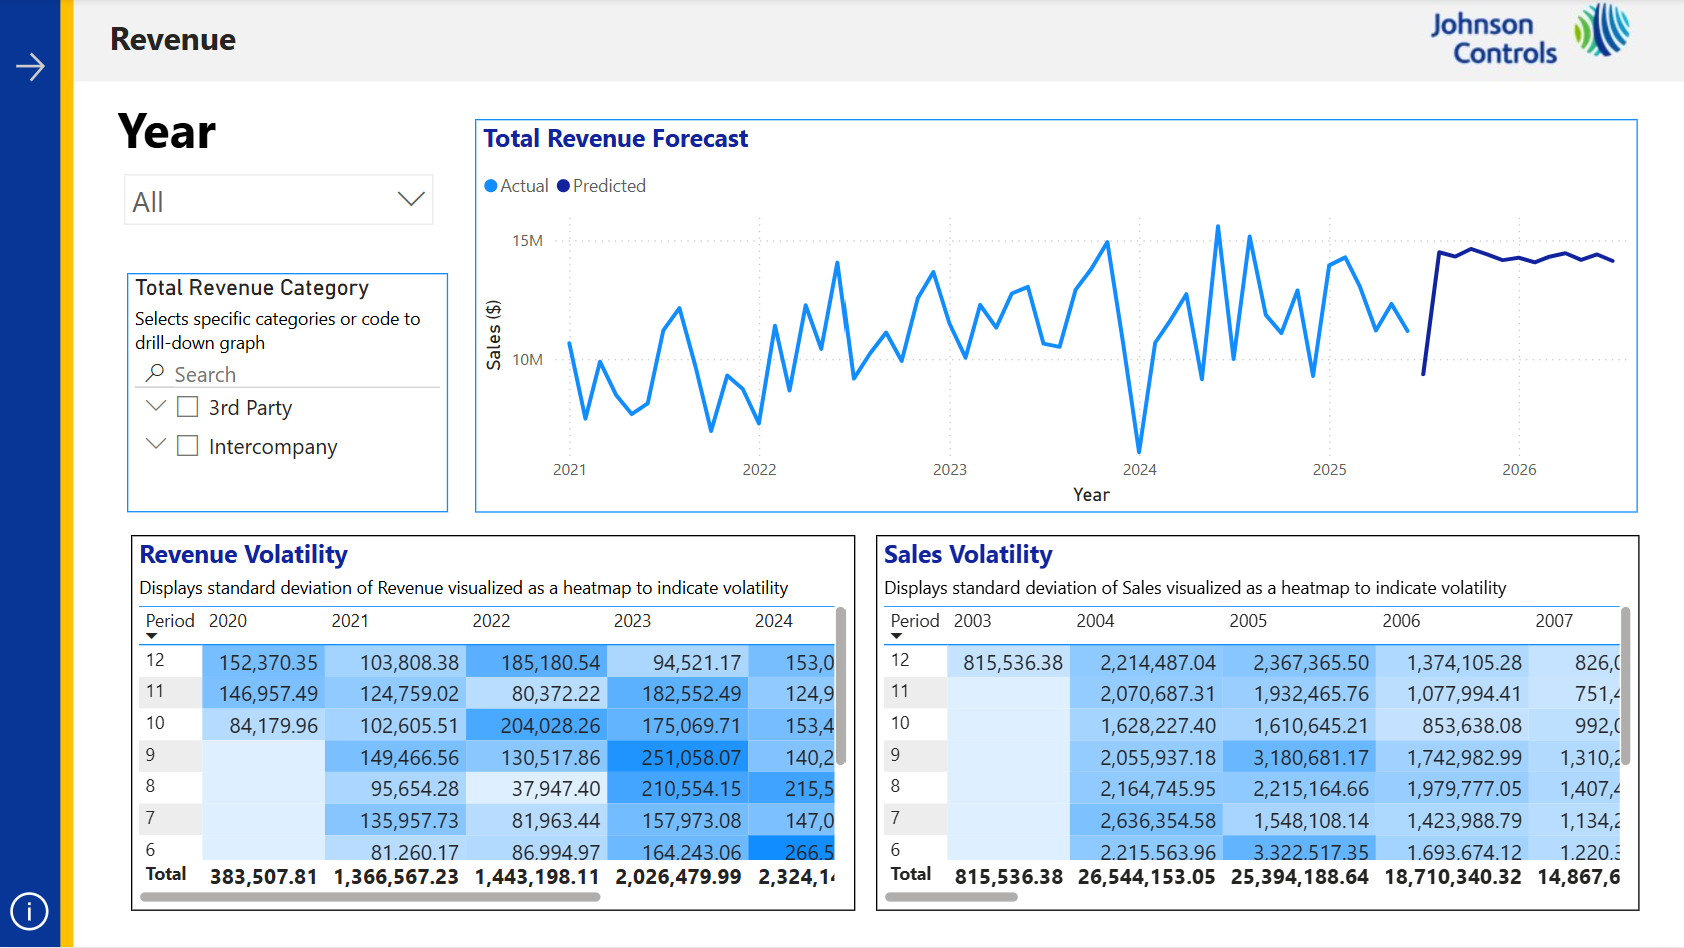
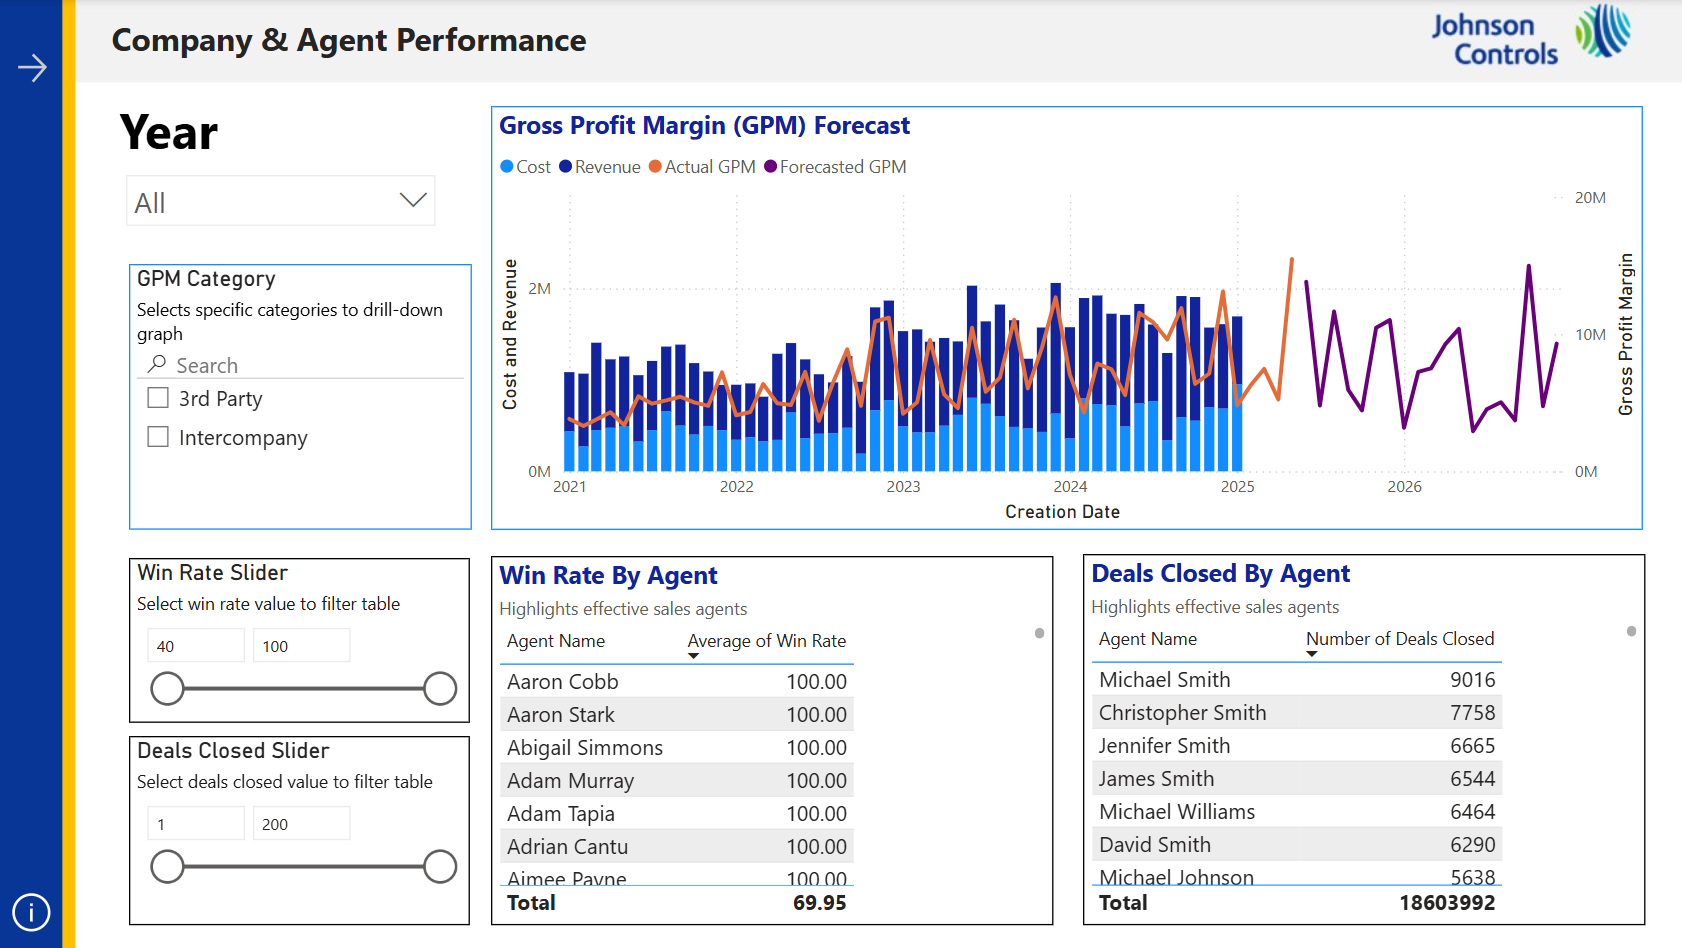
The dashboard is incorporated further with predictive machine learning models that could analyse existing data and forecast future trends. This allows Johnson Controls to stay ahead of market changes and enhance strategic planning.

The automation of the data visualisation and forecasting processes is expected to relieve up to 24% Full-time Equivalent of a sales agent's time from non-sales tasks, increasing sales productivity and boost overall team performance.

Key Features

The automated data processing, visualisation and forecasting process allows the dashboard to be updated every week, an improvement over the current monthly refreshes. Sales analysts can stay up to date with the latest live data and provide real-time insights for deciding future sales strategies.

Each refresh can be completed within 10 minutes, enabling efficient data analysis and forecasting. Sales agents would have more time to perform selling tasks and secure deals with their customers, boosting sales productivity and team performance.

The interactive Power BI dashboard enables sales performance summaries at a glance, complete with drill-downs and filters that allow sales analysts to explore individual performance of sales agents.

Sales analysts can also explore various metrics by navigating through different pages for sales, orders, agent performance, etc. Each metric aligns with the company's business objectives, ensuring relevance to stakeholders.

Forecasts are generated with the help from predictive machine learning models tailored to each sales performance metric. These models seek to identify insightful patterns in sales data, allowing analysts to compare real-time performance and forecasts and spot trends instantly.

Our models have been tested to achieve at least 80% accuracy on unseen data, enhancing trust of sales analysts on the forecasts. Our prediction models can also achieve short training times, enabling fast forecast generation and visualisation on the dashboard.

Work Flow

Comprehensive Data Resources

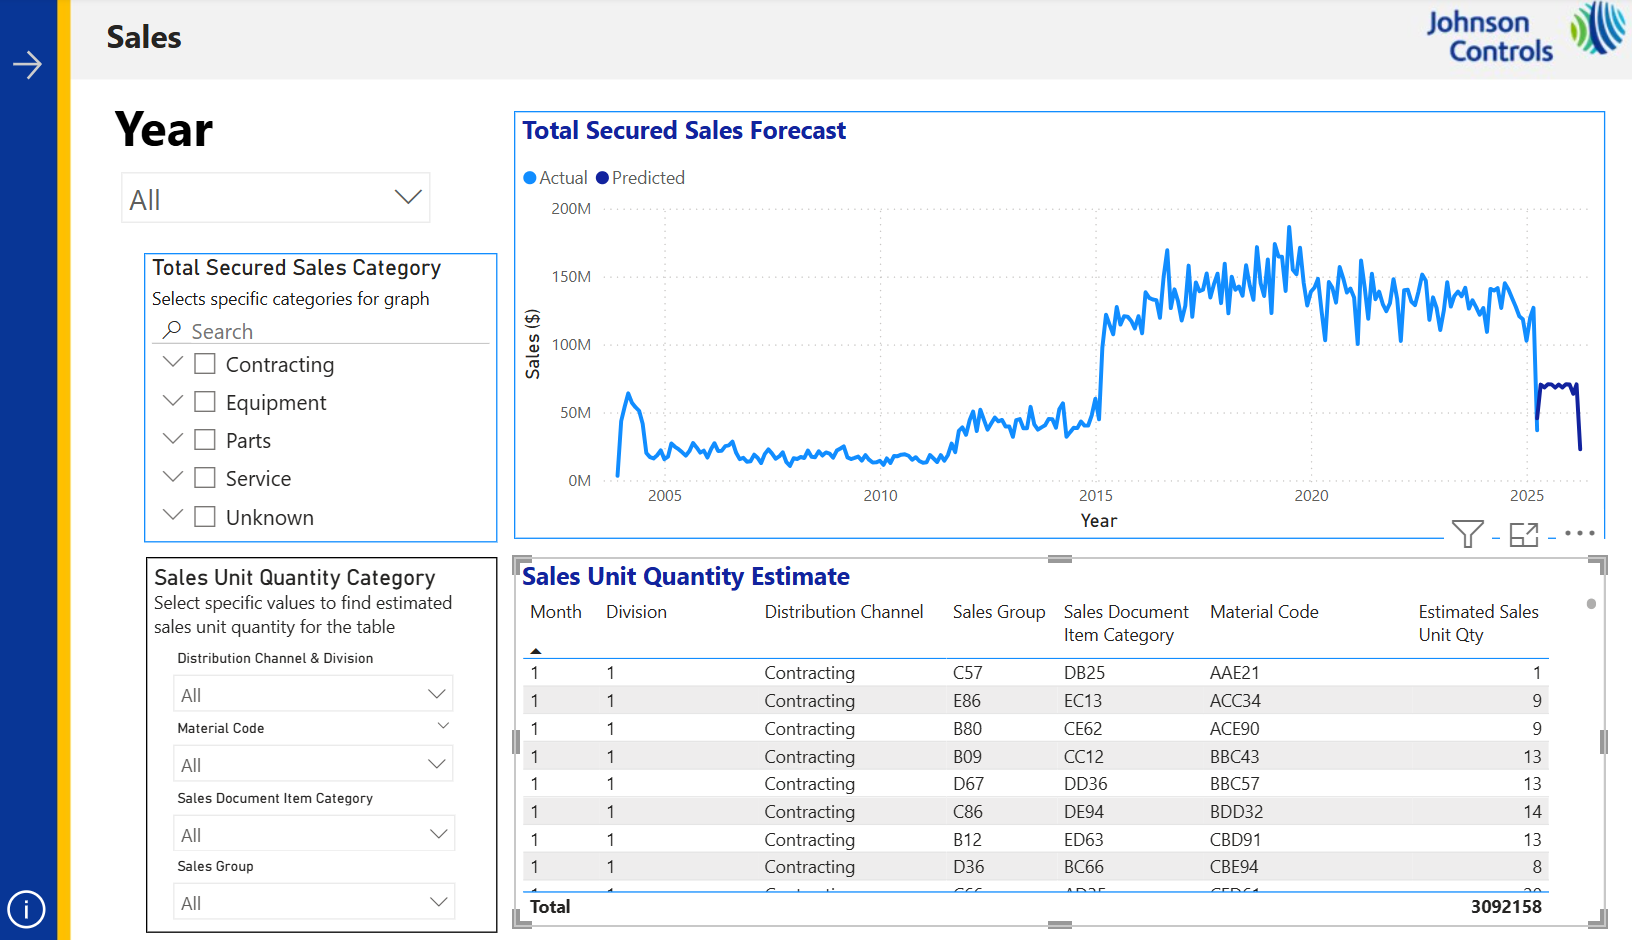
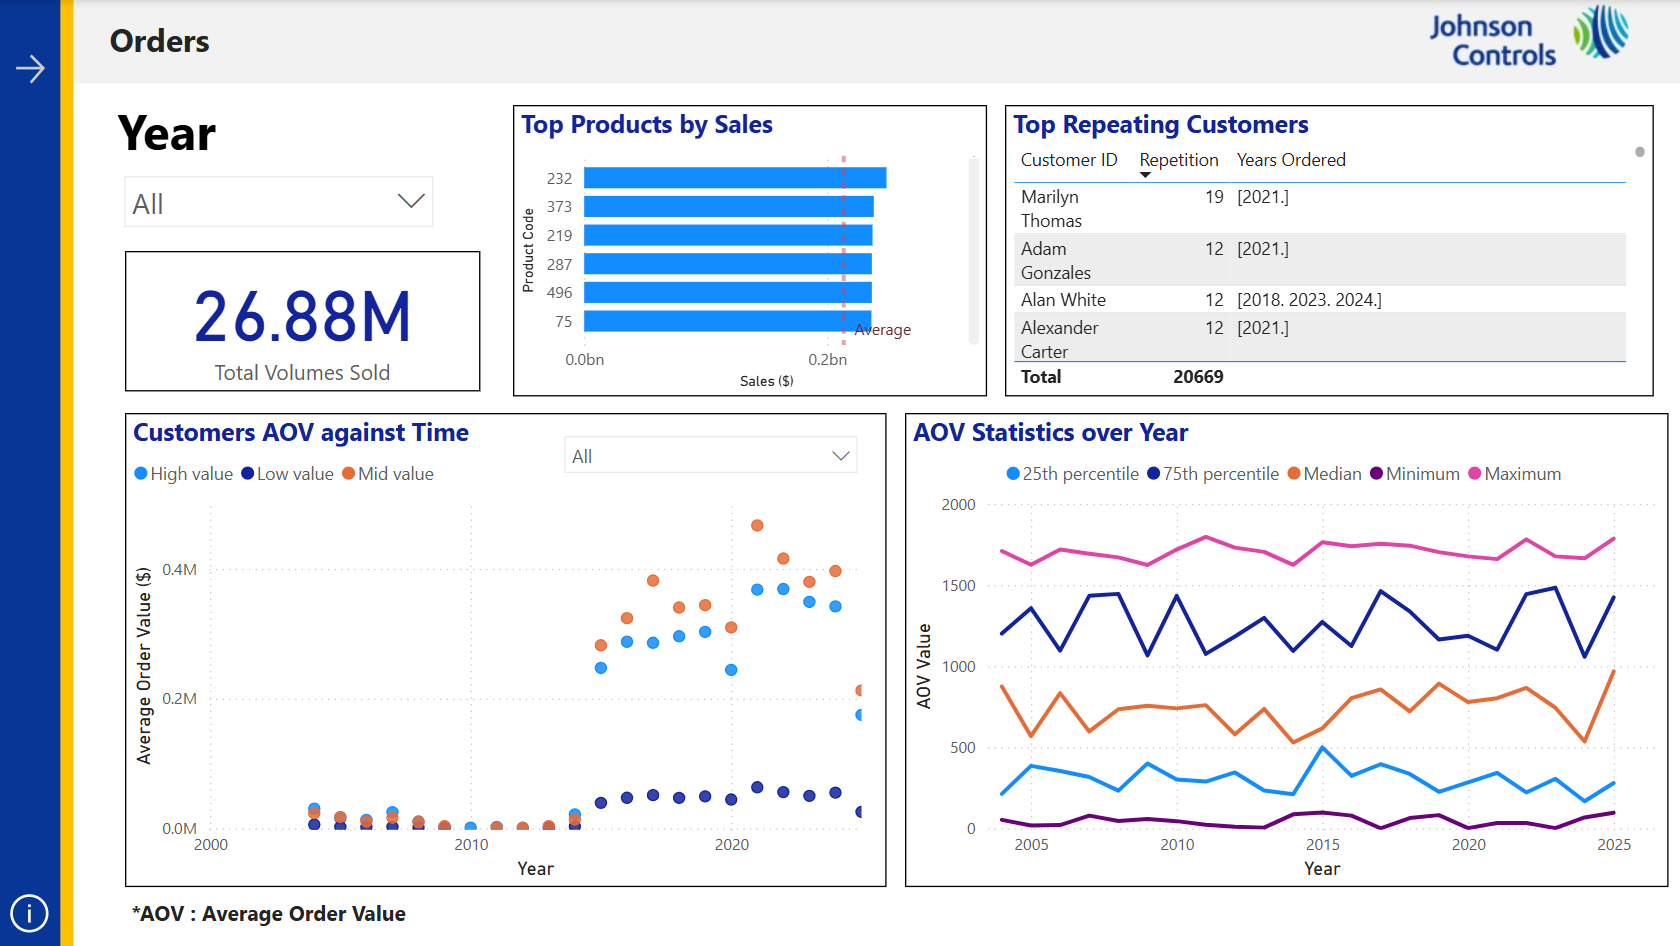
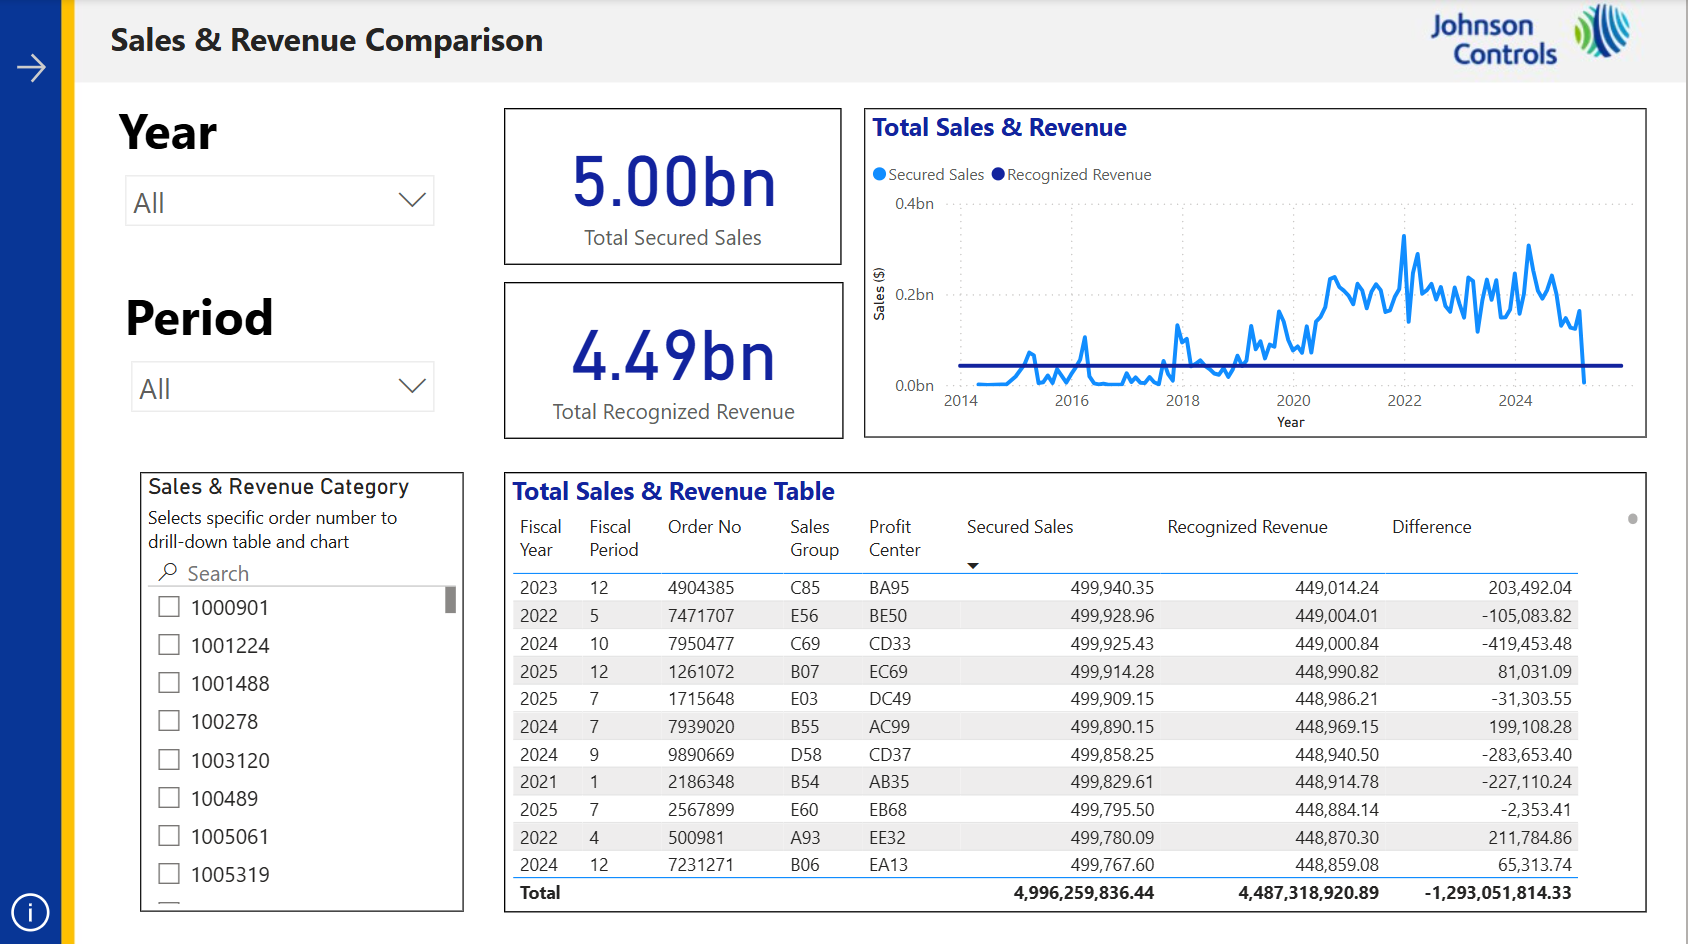
Sales data from various sources enables an overview of the overall sales performance of the company:

  • Sales & Orders
  • Revenue
  • Sales Agent
Logo of Snowflake, a centralised database provider
Shared Internal Platform

Centralised data-sharing platform enables seamless collaboration between analysts and developers

Microsoft SharePoint Logo
ML Forecasting Models

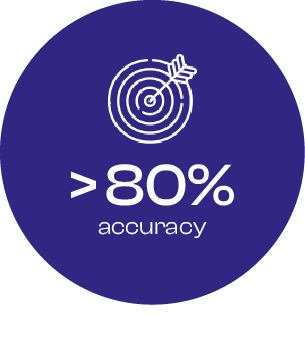
High-accuracy ML models generate plausible sales forecasts in real time, enabling identification of future sales trends

Python Logo
Interactive Dashboard

Updated data and forecasts are loaded into the Power BI dashboards every week, keeping analysts up to date with the latest sales data and performance trends

Power BI logo

View our poster here

To Top

In partnership with :

Acknowledgements

SUTD Capstone Group S36 would like to thank our Capstone instructors: Assistant Professor Xiong Zehui, Senior Lecturer Sumbul Khan, Senior Lecturer Franklin Anariba, as well as mentors from the Centre for Writing and Rhetoric (CWR): Dominic Quah and Rashmi Kumar for their valuable advice which were crucial to the project’s success.

The team would also like to thank our industry mentors from Johnson Controls (Singapore) Pte Ltd: Loh Ying Ting, Shirley Lye, Faith Goh, Sathiyaa, Ajay Sharma, Ong Wen Yie and Ronnie Lim for their precious guidance and support as well as providing valuable resources which were vital in materialising the project.

Menu

ornament-menu

Contact the Capstone Office :

+65 6499 4076

8 Somapah Road Singapore 487372

Please fill in your information below and feedback

Contact the Capstone Office :

8 Somapah Road Singapore 487372

8 Somapah Road Singapore
487372

Welcome back!

Log in to your existing account.

Contact the Capstone Office :

+65 6499 4076

8 Somapah Road Singapore 487372

Welcome back!

Log in to your existing account.