Current Challenges
1. Multiple feedback data manually consolidated and analysed separately
2. Manually analysing public sentiment from social media platforms
3. Current feedback revolves about negative charging experience
4. Current dashboard limited to monitoring feedback turnaround time and lacks advanced analytics capabilities
Problem Statement
How might we streamline and automate feedback from multiple data sources to understand and analyse the topics people are concerned about regarding Electric Vehicles (EVs)?
Solution Overview
To address the problems, we envisioned our solution to be able to integrate current and new data sources together and conduct content tagging, sentiment analysis and topic discovery on these data. The end product should be a simple and intuitive dashboard with customizable visualizations and an easy-to-manage database.

Project and Software Architecture
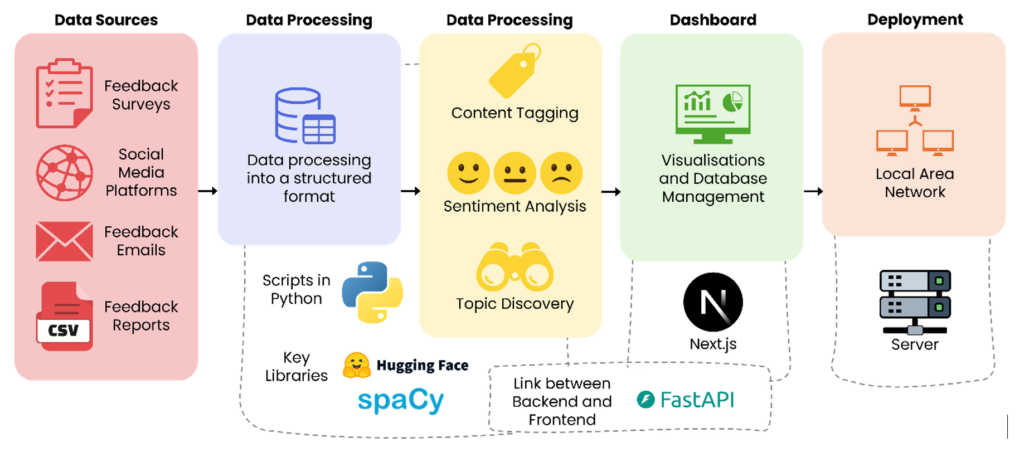
EVlectrifying Sentiments
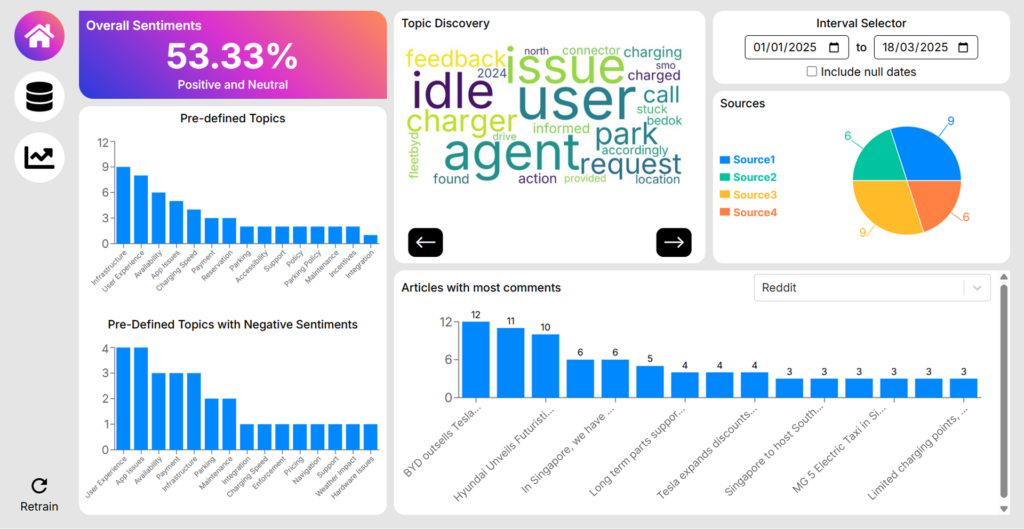
Home Page
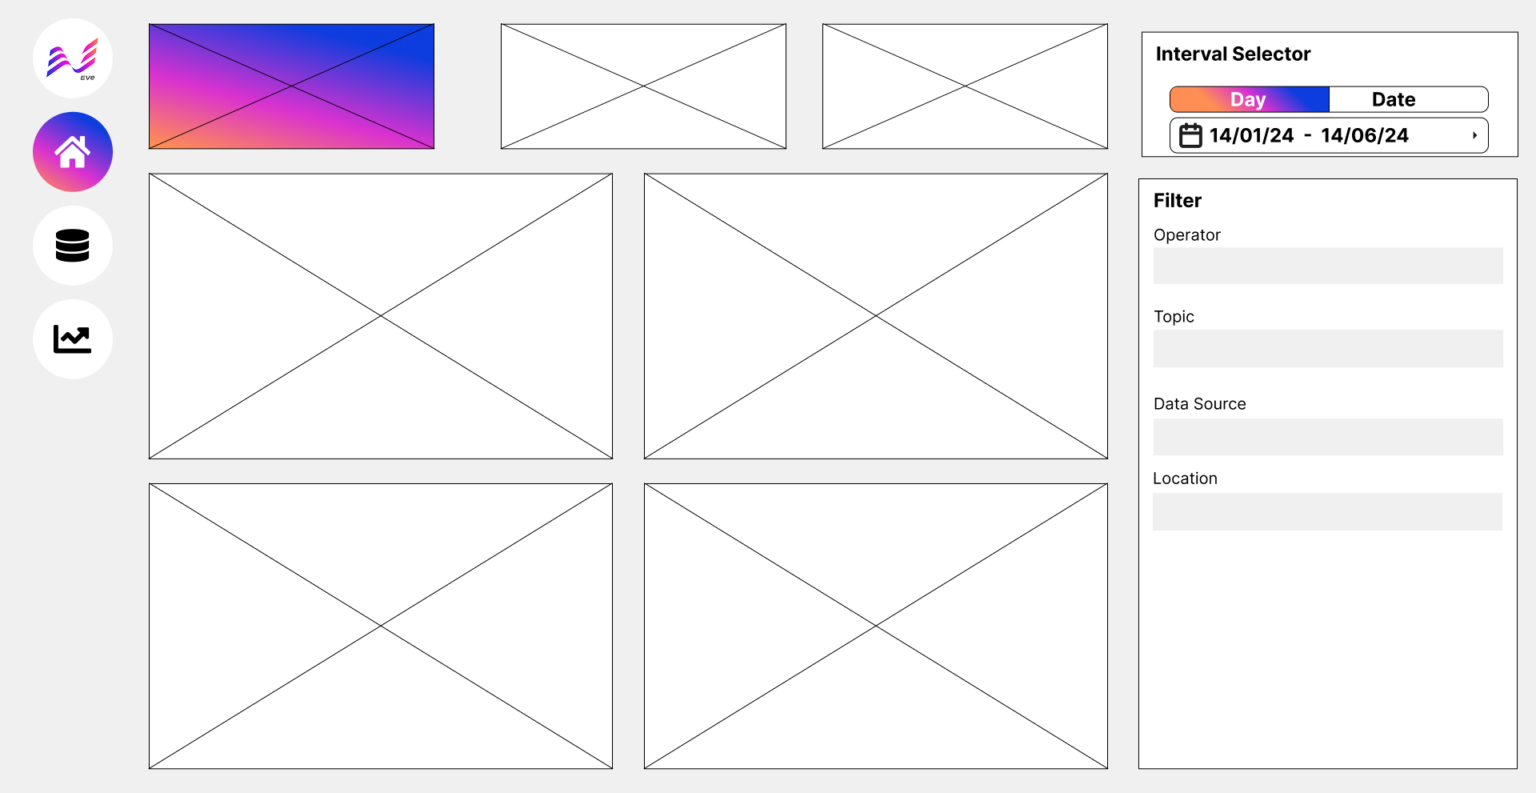
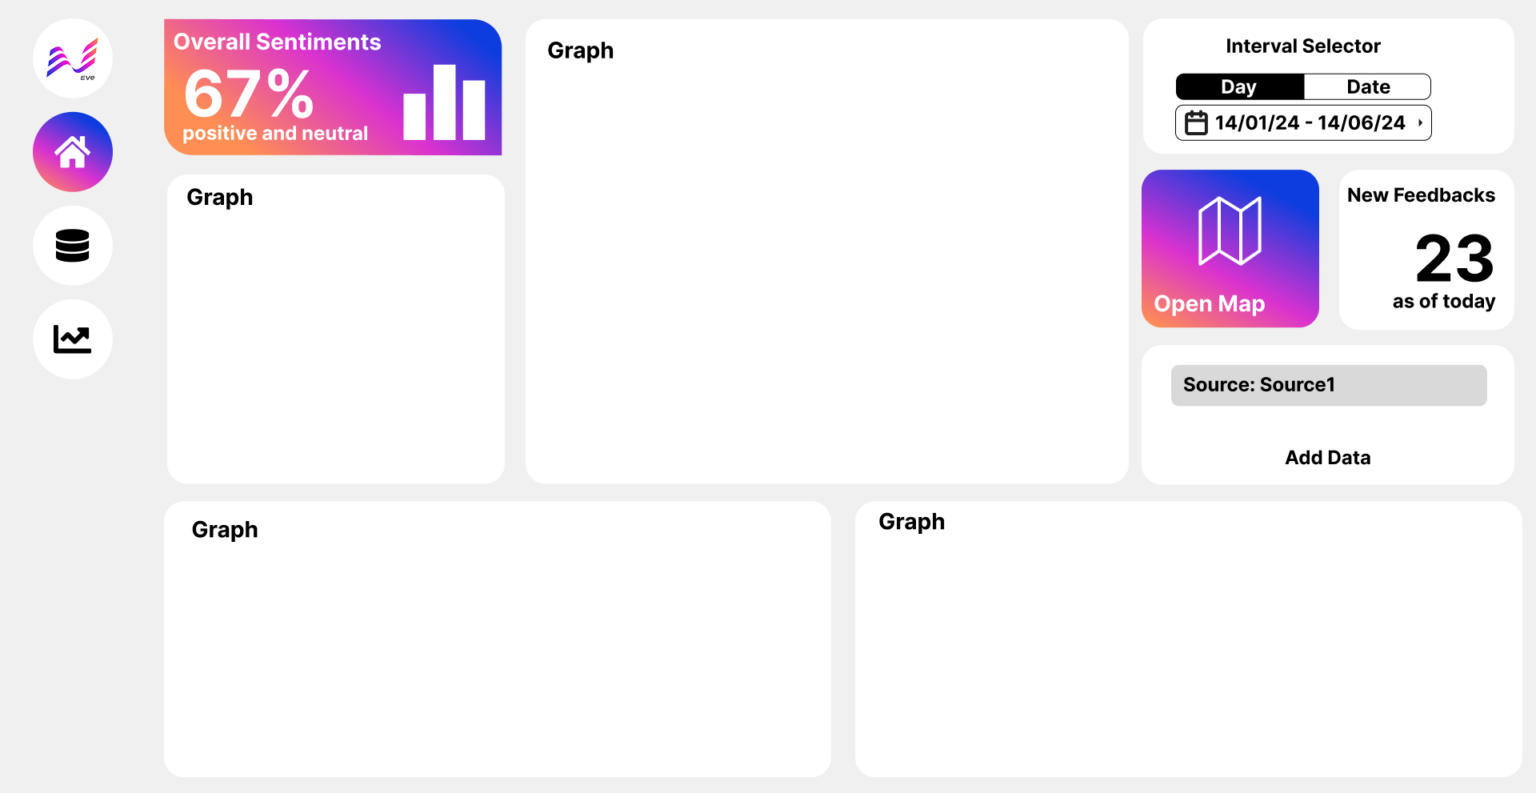
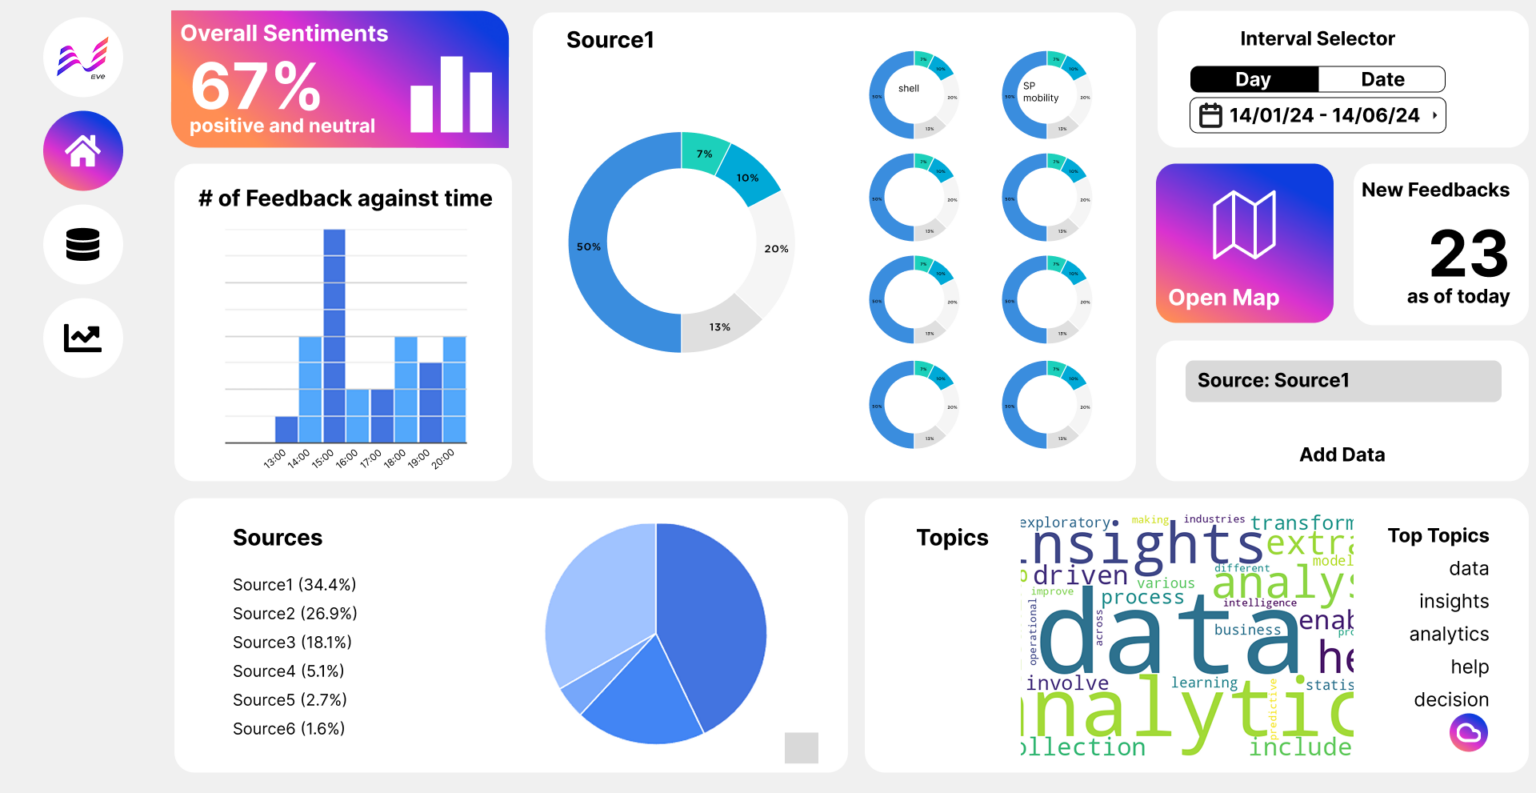
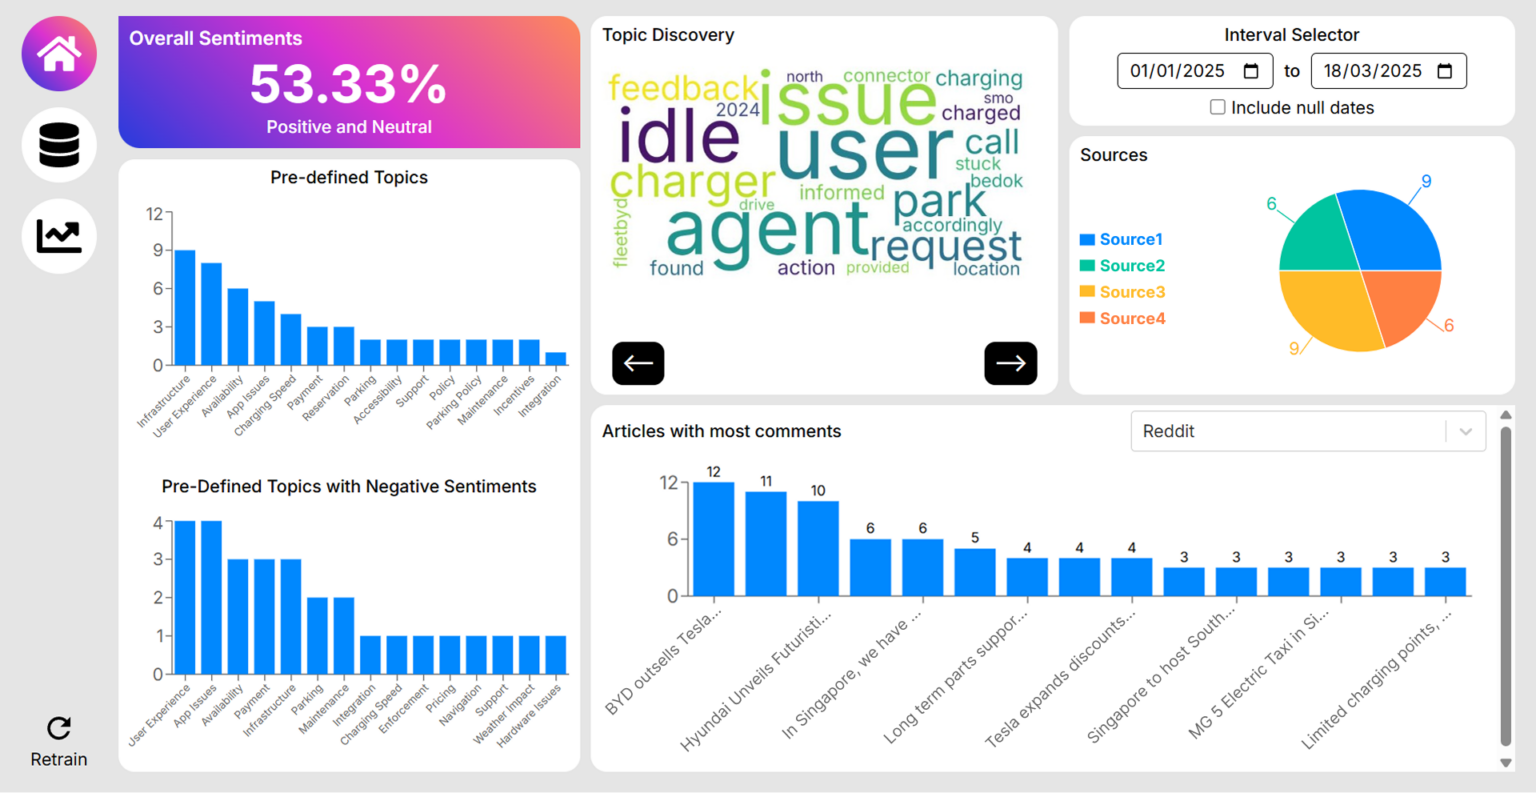
The Home Page provides EVe with a high-level overview of key statistics and trends in feedback data. It includes an overall sentiment analysis, showing the percentage of positive and neutral feedback, as well as pre-defined topic insights. The word cloud dynamically highlights commonly discussed topics within a selected period, offering quick insights into trending concerns. Users can also filter data sources and timeframes to refine their analysis, ensuring they stay updated on critical feedback trends.
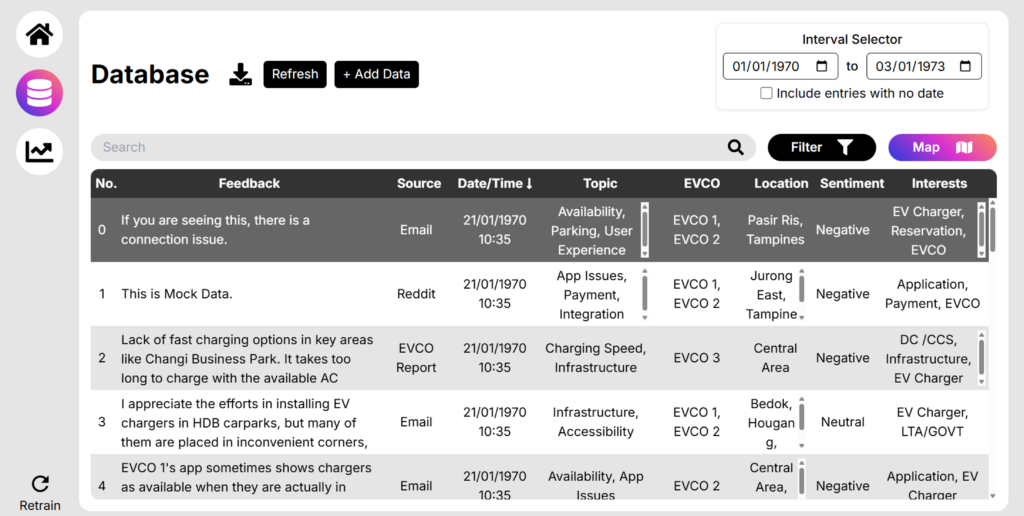
Database View
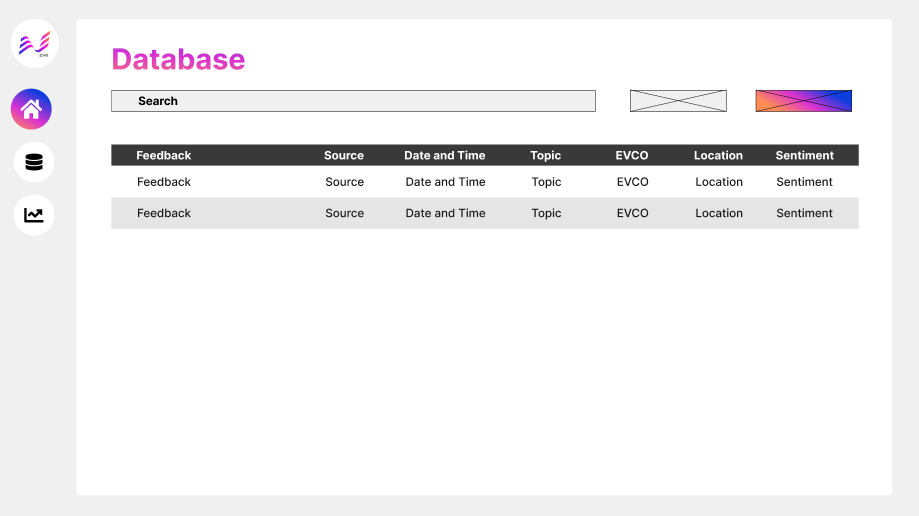
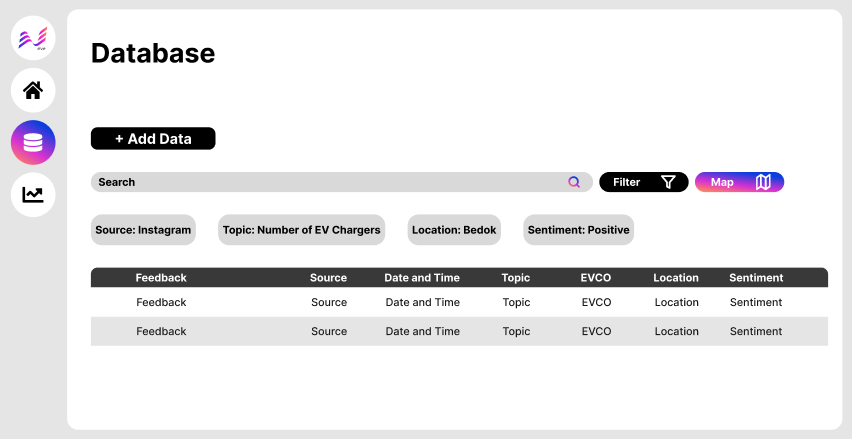
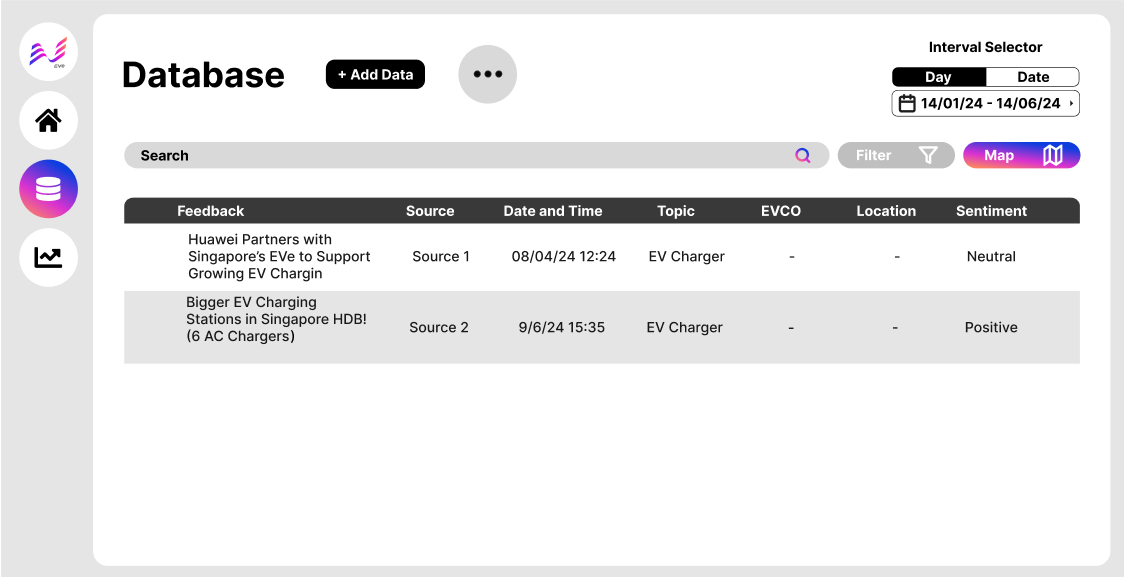
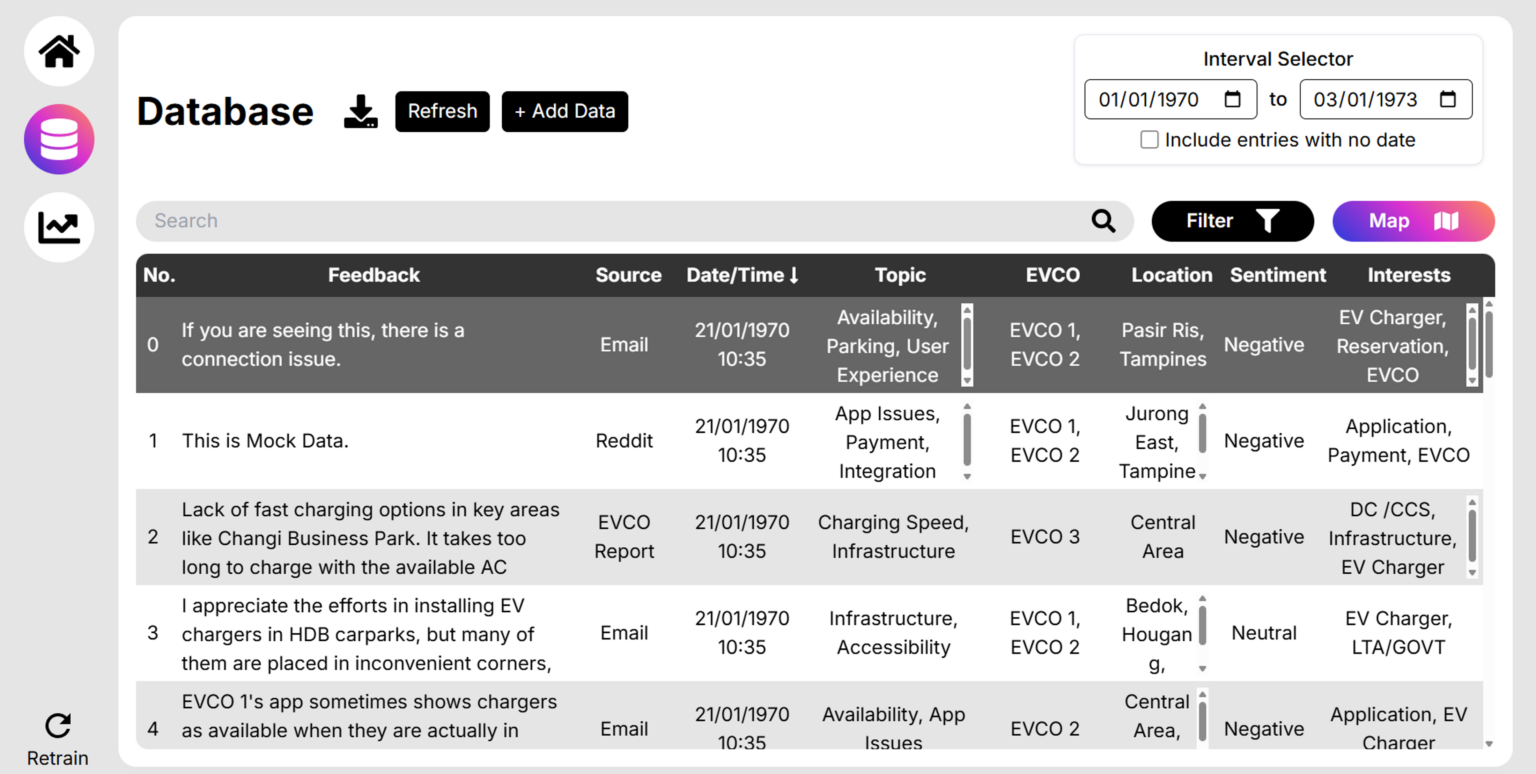
The Database Page serves as the central hub for managing and analyzing incoming feedback data. Users can upload new data via multiple sources, including CSV files, discussion from social media, and manual input. Once data is uploaded, the system automatically performs content tagging, generating topic and interest tags for each entry.
Additionally, sentiment analysis is conducted to classify feedback as Positive, Neutral, or Negative. For database management, users can manually add or delete rows, filter entries by category or time period. The database also features automated data cleaning and parsing, ensuring consistency and accuracy in stored information.
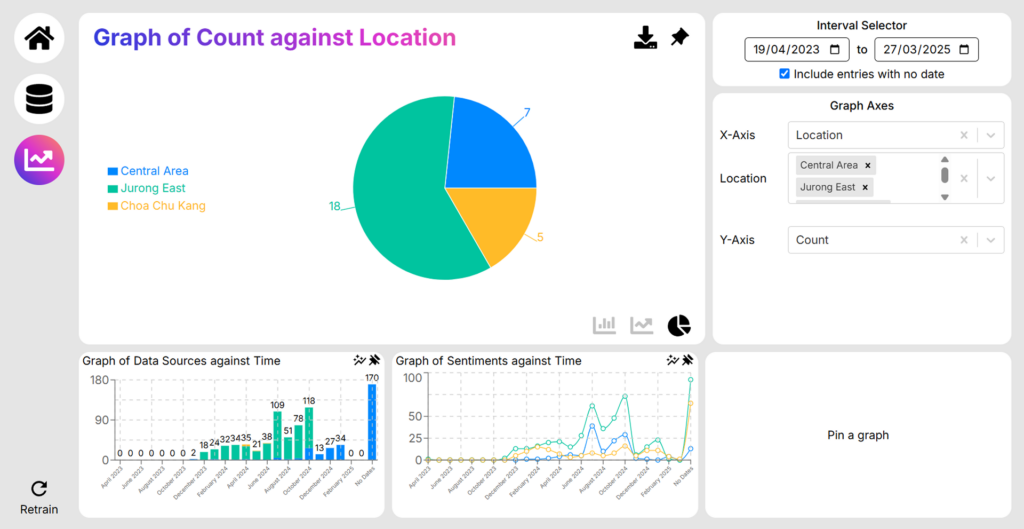
Analytics Page
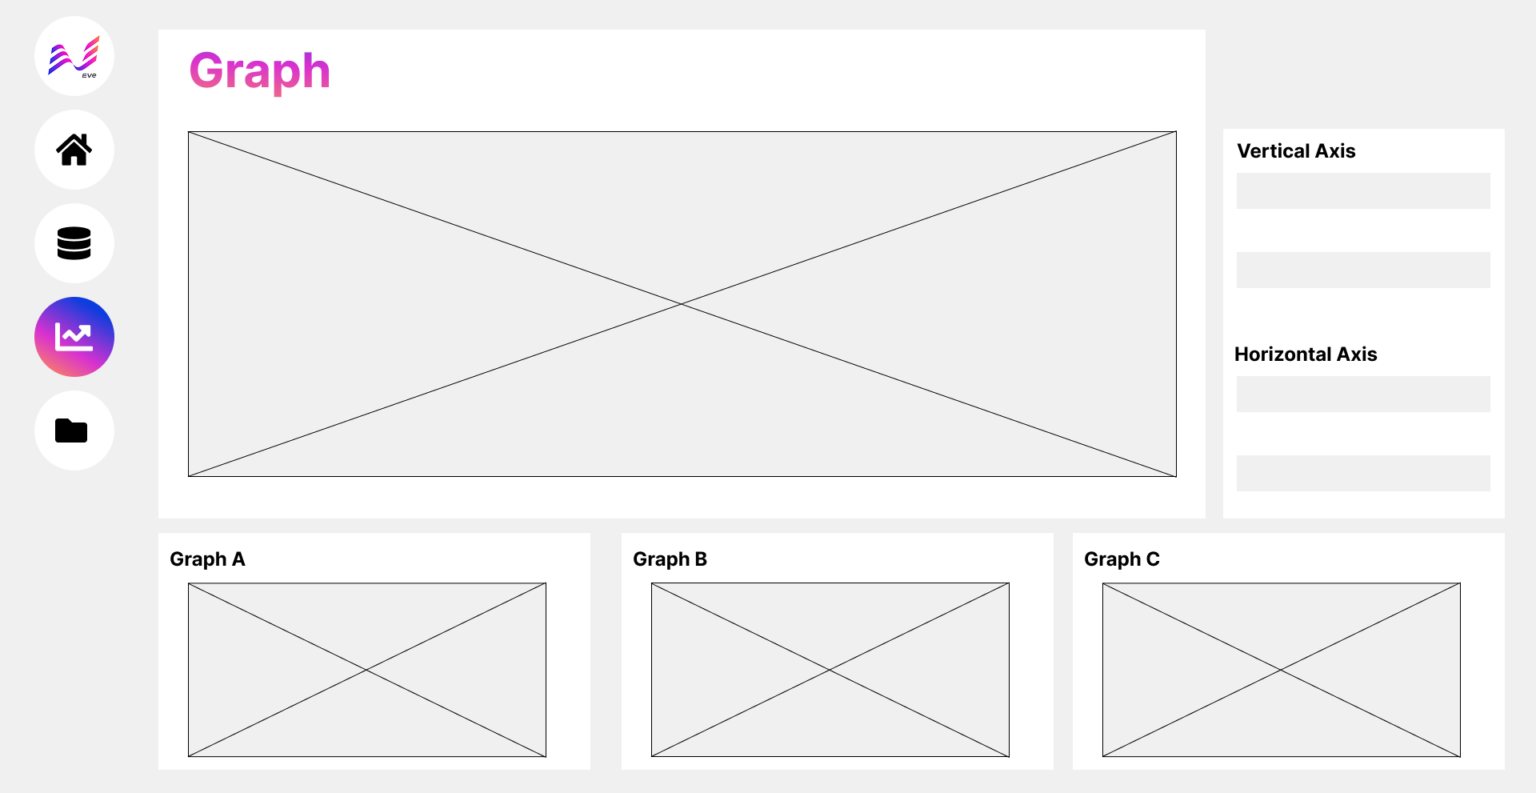
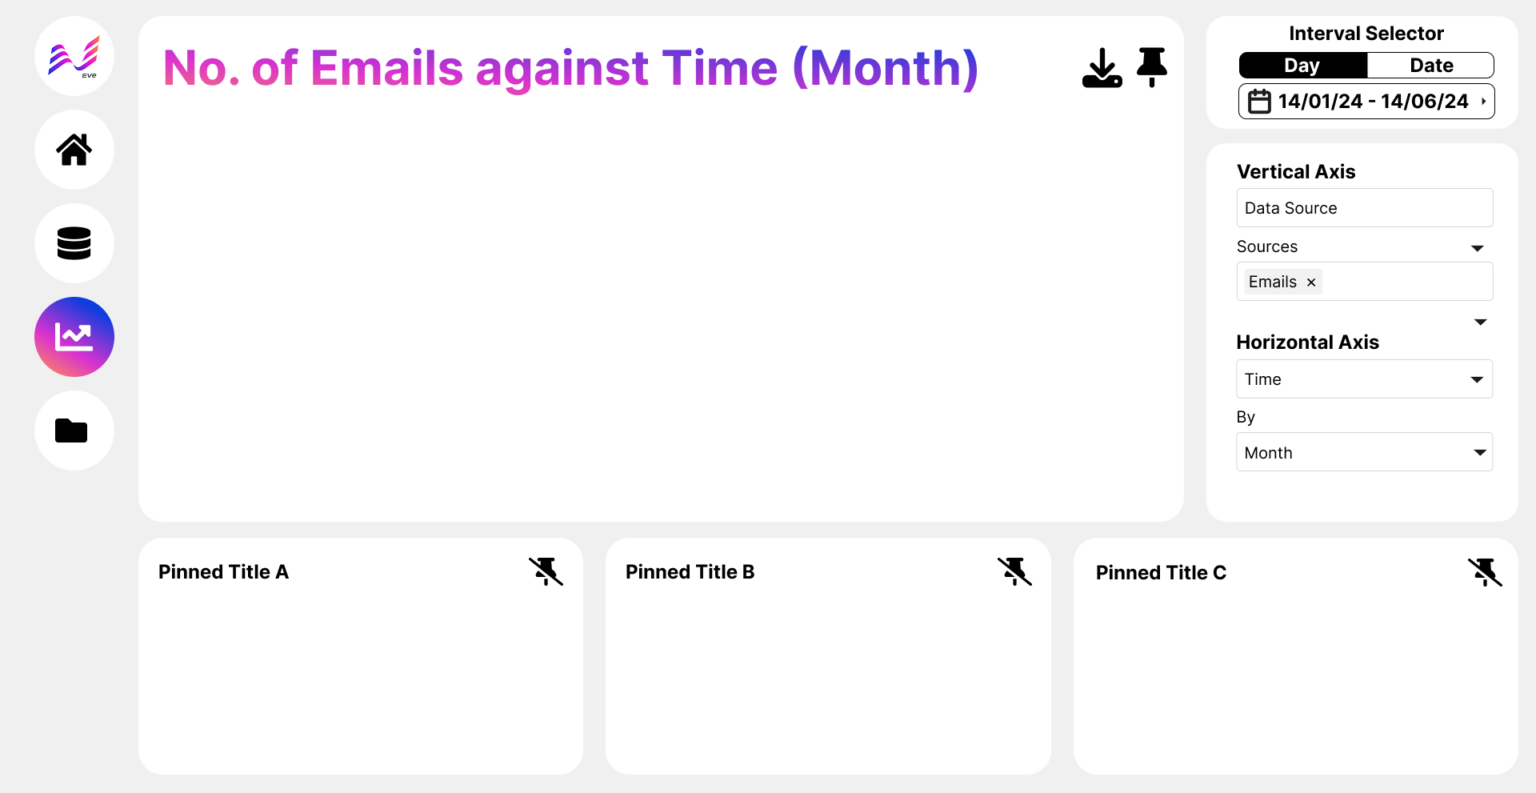
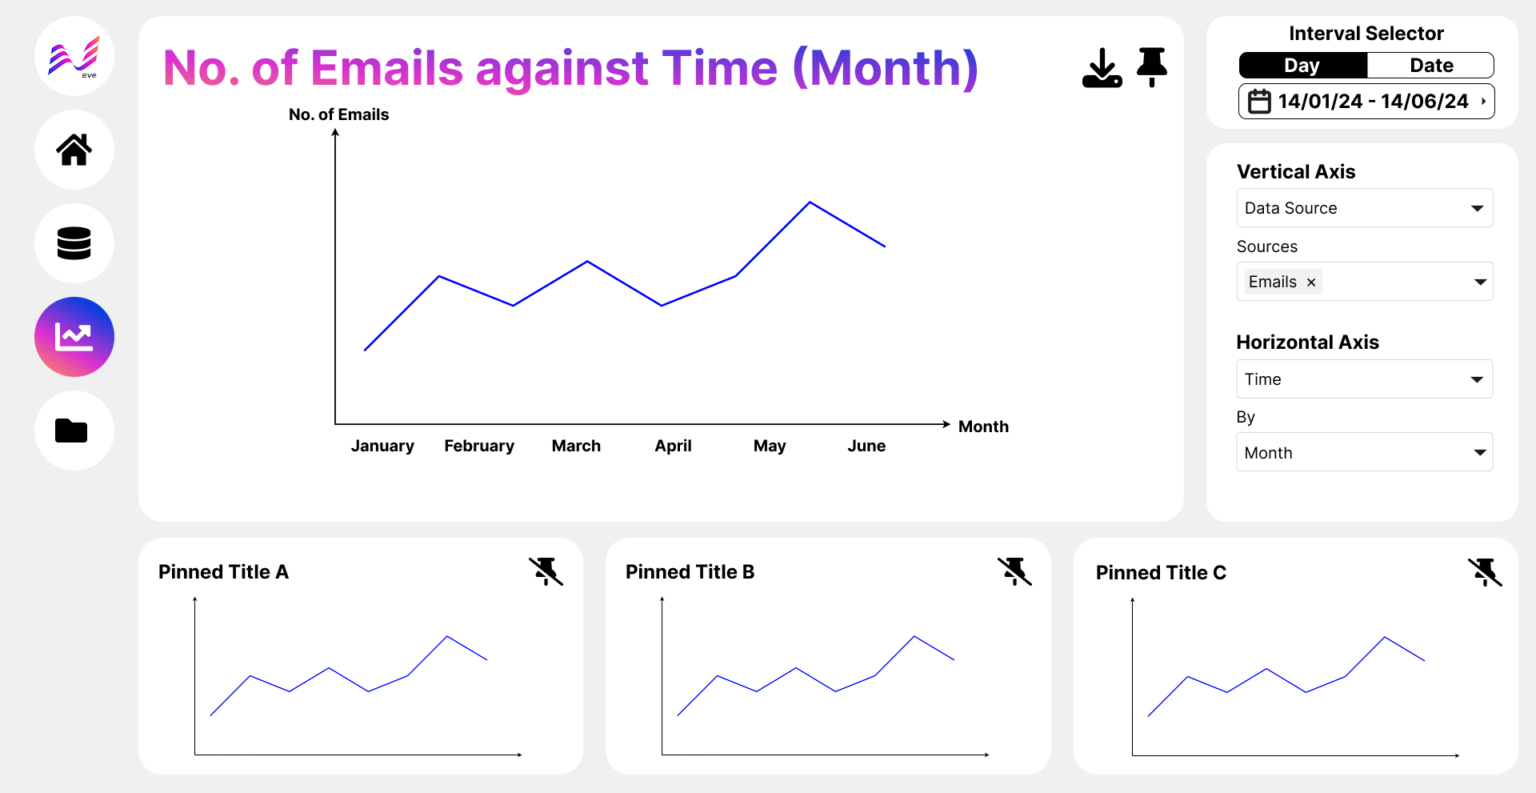
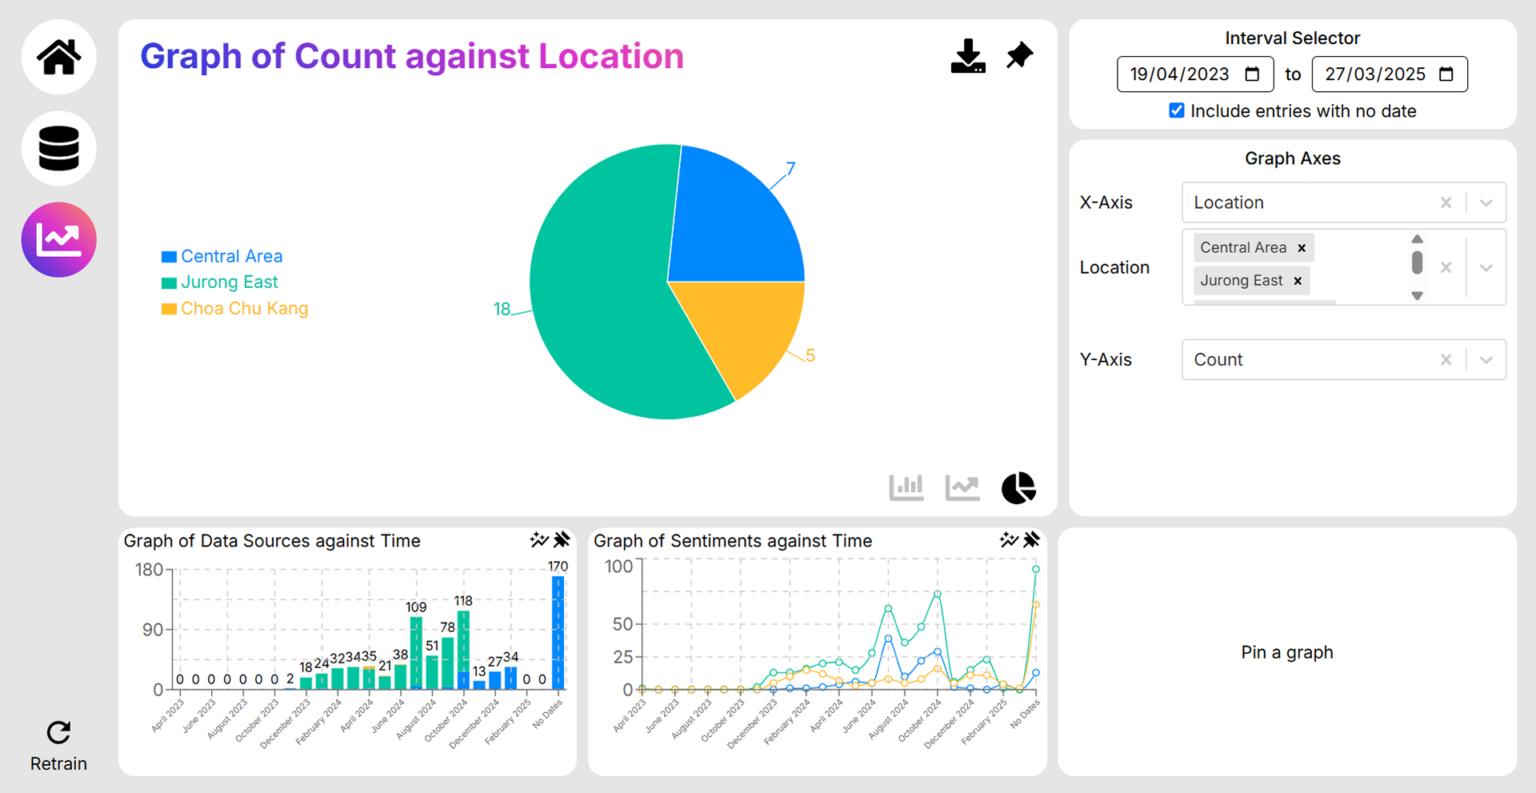
The Analytics Page allows users to conduct advanced data analysis through customizable visualizations. Users can modify axes to display different categories, choose from various chart types, and adjust the date range to suit their needs. This flexibility enables users to generate reports, present insights in meetings, and track long-term trends with ease. The interactive design ensures that data exploration is intuitive, making it simple to uncover patterns and underlying trends.
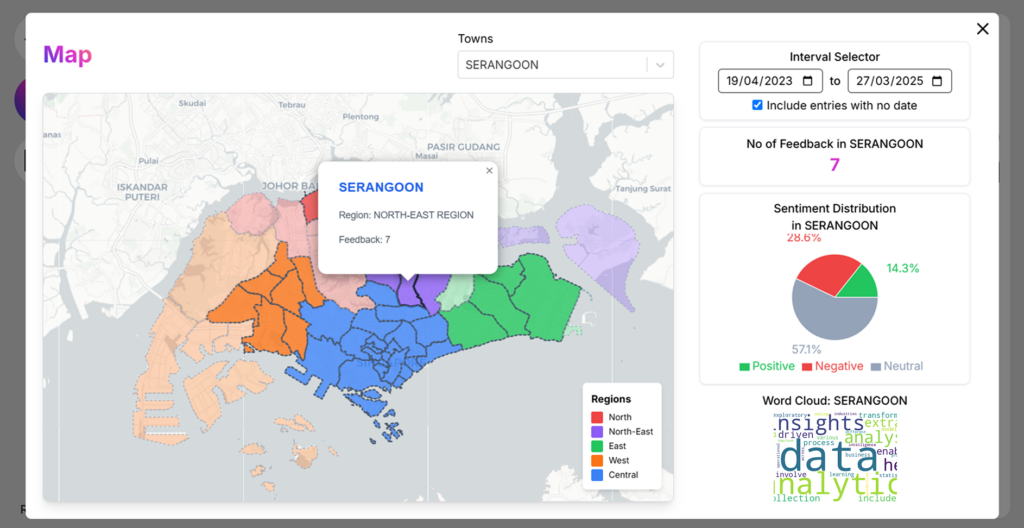
Map View
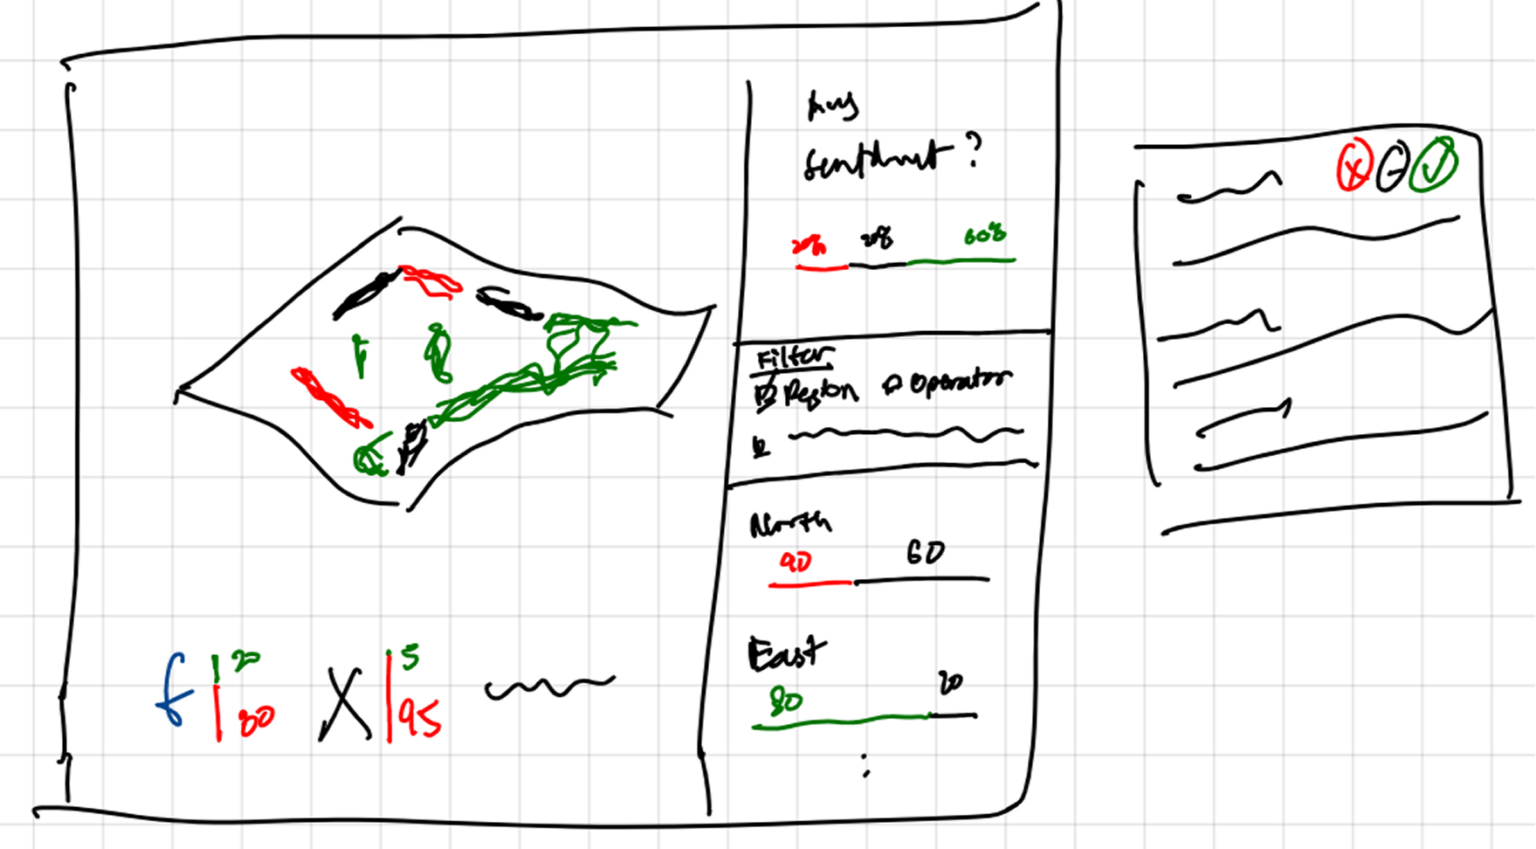
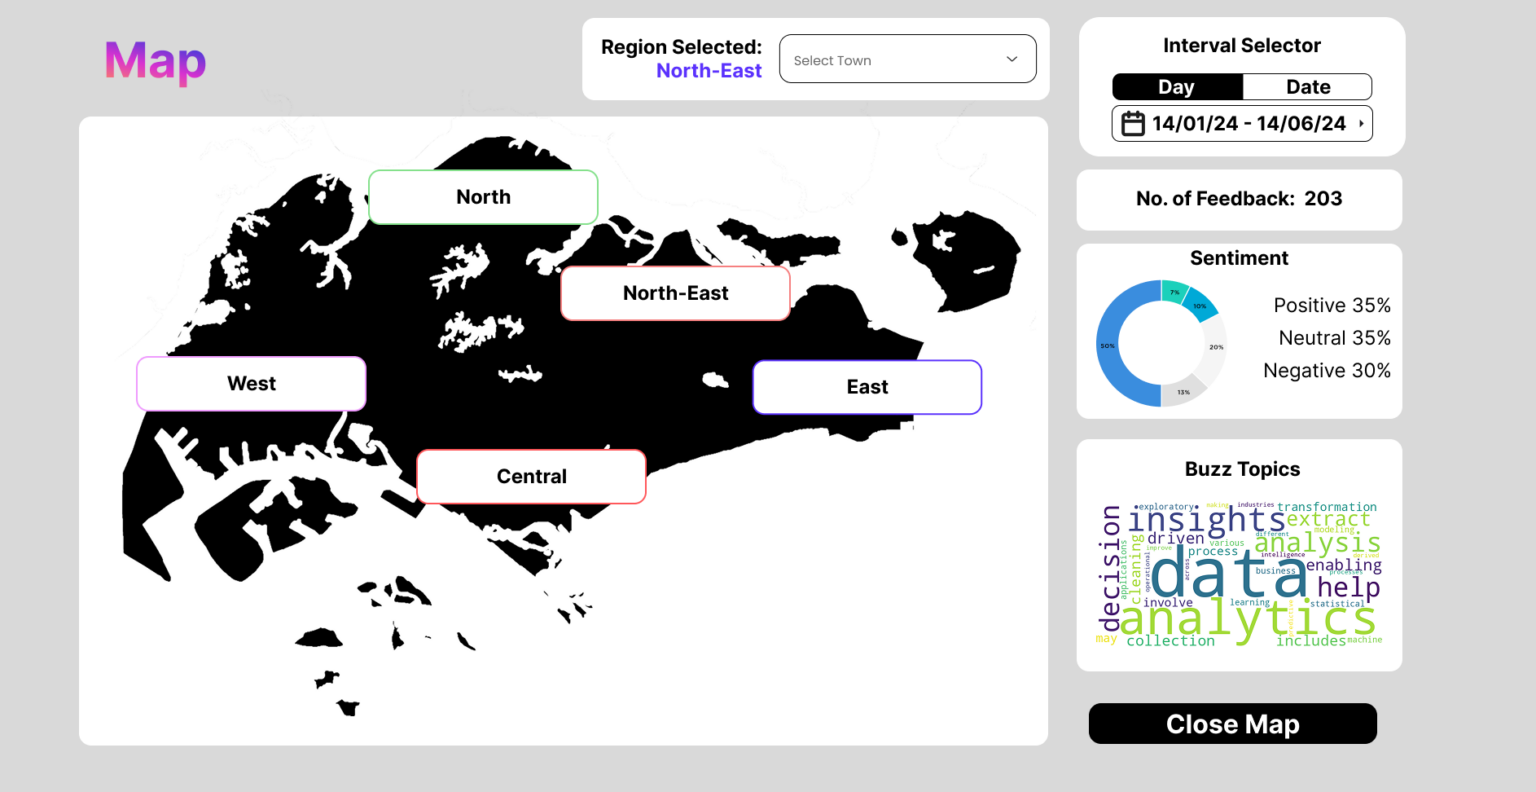
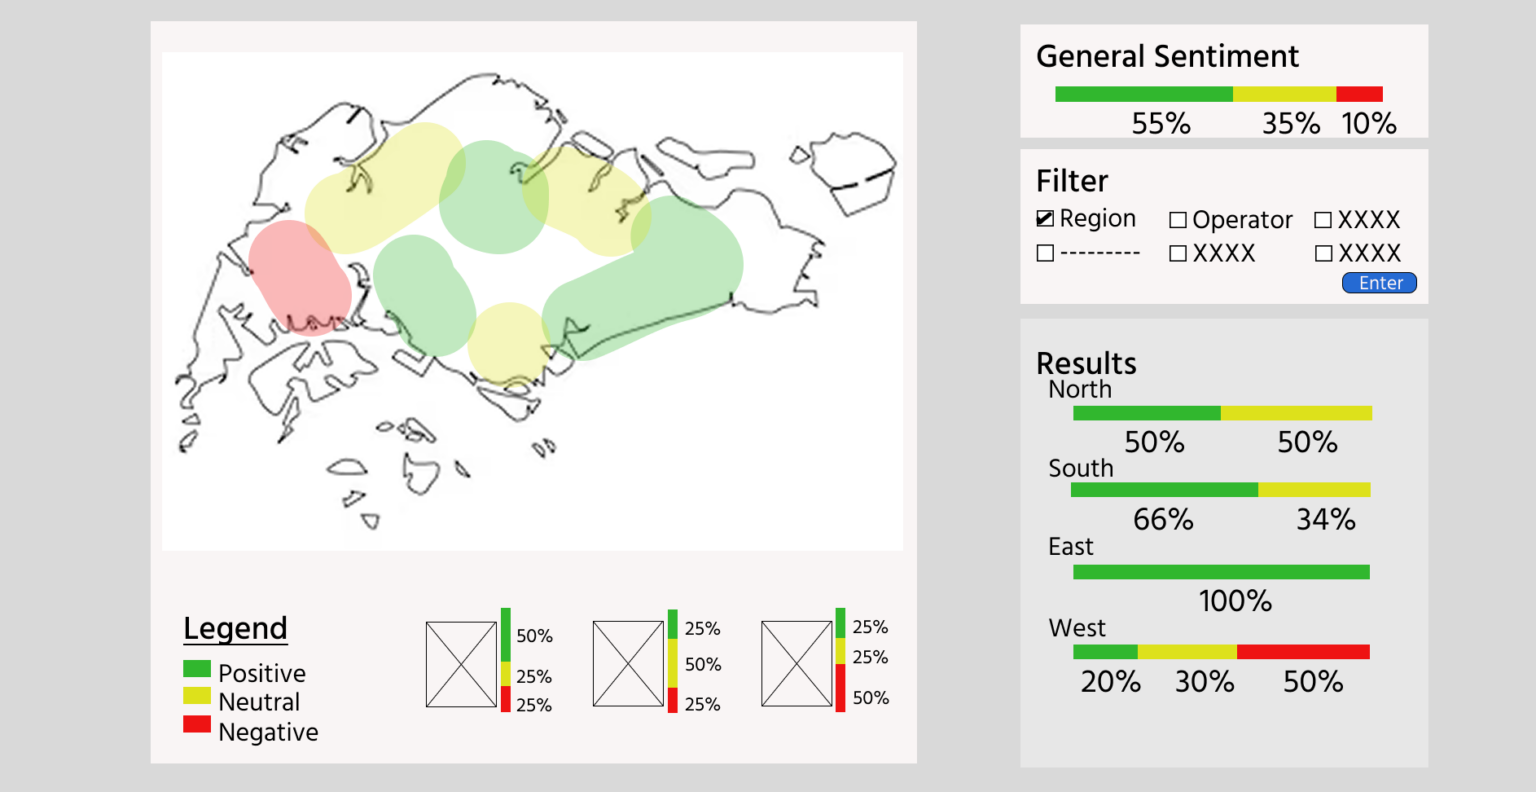
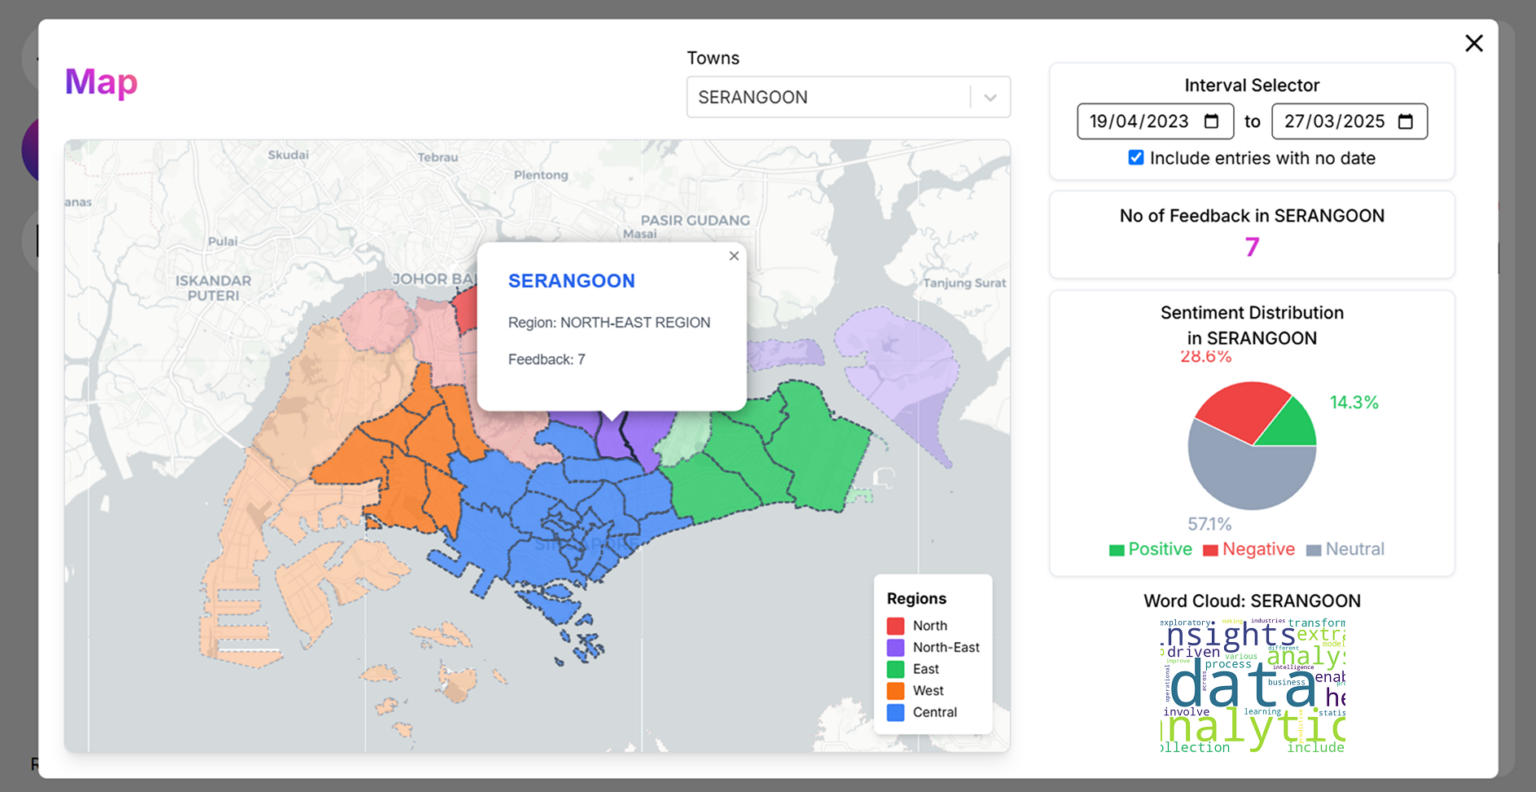
The Map View provides a geospatial view of feedback data, allowing users to track feedback locations over time. Users can filter by towns and date range to analyze regional trends and identify patterns in different areas. This visual representation helps in understanding geographical distribution, spotting high-feedback zones, and making location-based decisions efficiently.
Prototyping
Home Page
Database Page
Analytics Page
Map View
